
I’ve updated the model with all the latest data, and it’s mostly good news – at least for what happens over the next few months. There might be a bit of a ‘sting in the tail’ in the winter, but I think there are ways of dealing with that. Summary conclusions as follows: 1/
1. In my central case, the summer 2021 wave should be relatively small compared to previous waves (peaking around 5k hospitalisations per week)
2. Even in downside scenarios with higher R0 for Delta or a larger Step 4, there should be little risk of overwhelming the NHS 2/
2. Even in downside scenarios with higher R0 for Delta or a larger Step 4, there should be little risk of overwhelming the NHS 2/
3. However, opening earlier than 19th July would significantly increase those risks, and is not recommended
4. Assuming things go well in the summer (i.e. with a small wave), we may yet face the challenge of finding a few more % points of immunity in the autumn. 3/
4. Assuming things go well in the summer (i.e. with a small wave), we may yet face the challenge of finding a few more % points of immunity in the autumn. 3/
...Options include boosters and vaccinating teenagers, although that may not be needed if heterogeneity effects turn out to be significant.
5. Stronger seasonality effects (or waning immunity) could counter-act the benefits of extra vaccinations &/or heterogeneity. 4/
5. Stronger seasonality effects (or waning immunity) could counter-act the benefits of extra vaccinations &/or heterogeneity. 4/
So we may still have some complex waters to navigate in the autumn and winter, but I think our course for the next couple of months is clear: open up to Step 4 on 19th July, deal with the (hopefully small) summer wave, and review strategy again in August. 5/
Details follow in long thread, but first a nostalgic note: this is version 30 of the model, which is built on a core that I developed back in January to explore policy choices around vaccination, and options for relaxing restrictions – see below: 6/
https://twitter.com/JamesWard73/status/1350452745967435779?s=20
A lot has changed since then (although it’s amusing to note that some of the things I had on the development list back then, such as allowing for waning immunity, are still on the development list!). Anyway, back to the present, and I’ve changed a few assumptions: 7/
1. I’ve updated the vaccine rollout schedule to the latest view, based on government targets plus insights from @PaulMainwood and @john_actuary (thanks guys)
2. I’ve also tweaked my vaccine take-up assumptions, going a bit higher in the older groups 8/
2. I’ve also tweaked my vaccine take-up assumptions, going a bit higher in the older groups 8/
…(to align with actuals) and lower in the younger groups – now assuming 75% take-up in the under-50s, down from 85%. (but I’d love to be proved wrong on this).
3. Based on rumoured JCVI decisions, I’ve kept under-18s out of the vaccination schedule in the central case 9/
3. Based on rumoured JCVI decisions, I’ve kept under-18s out of the vaccination schedule in the central case 9/
4. On vaccine efficacy (VE), I’ve used the latest PHE data on VE vs hospitalisation, and used the symptomatic disease figures to make an assumption for VE vs. infection. I assume that breakthrough infections continue to be 40-60% less infectious. 10/
https://twitter.com/kallmemeg/status/1405851031909634050?s=20
5. I’ve also assumed that Delta causes a loss of about 5% of the immunity from prior infection – which would be consistent with a reinfection rate ~50% higher than that for Alpha. The data on this remains sketchy, but I think that’s plausible. 11/
6. I’ve also used the PHE data that suggests Delta causes twice the rate of hospitalisation than Alpha, as this gives me a much better fit to current admissions. However I’ve not changed my IFR assumptions, as the model matches deaths fairly well already. 12/
With those VE and immunity escape assumptions, I can see that Delta would already have at least a c. 12% effective transmission gain vs Alpha. So it just remains to decide by how much Delta’s R0 has also increased, and hence its overall transmission gain. 13/
To work this out, I’ve taken a different approach to previously. Like some of the SPI-M teams, I’ve found it challenging to select a range of model parameters that adequately explains all the dynamics of May and early June, with changing prevalence of different variants, 14/
… the Step 3 re-opening, half-term effects, and changing weather. So to avoid that complexity, I’ve given the model a close match to current conditions (in mid-June), and focused attention on the things that will change going forward from here. 15/
In doing so, I’m helped by the fact that over the last week, R seems to have settled into a relatively stable position (around 1.25), and the level of variation in growth rate between different age groups has narrowed considerably, as seen below: 16/ 

Given this, I can get a good match to current data by assuming Delta’s R0 has increased by 30% vs. Alpha, which (combined with the immunity escape) would give it an overall effective transmission gain of ~45% - similar to PHE’s estimates of increased Secondary Attack Rates. 17/
I also examine below a pessimistic scenario where Delta’s R0 has increased by 55%, with an overall transmission gain of 75% - more similar to the central assumptions in the SPI-M models, and to previous analysis of Delta’s relative growth rate by @alexselby1770 and others. 18/
In order to get that scenario to work (and match current R), I have to assume that Step 3 was smaller than I thought, and only reflects ~50% of pre-pandemic contact rates, rather than the ~60% I have in my central case. I think this is unlikely, but can’t rule it out. 19/
Right, you’ve been patient long enough, and deserve to see some model results now. First, the central case, with the lower (~45%) overall transmission gain for Delta, and a re-opening to Step 4 on 19th July: 20/

As you can see, there’s a moderate wave in the short term (caused by Delta and Step 3) which peaks in mid-July, just before we move to Step 4 – this then extends the wave through August, and it continues through the autumn/winter with R not far off 1 while schools are open. 21/
Then something odd happens – we get a new wave in Spring 2022. This is an artefact of the model’s assumption that we remove the ‘baseline controls’ (e.g. TTI) and go back to full pre-pandemic normal behaviour from January 2022. 22/
Of course, that doesn’t have to happen then, but we also don’t want controls and cautious behaviour to continue indefinitely, so it’s helpful to see what happens if/when these are removed. I’m going to ask you to ignore this wave for now – we’ll come back to it later. 23/
Alternatively, if we’re in my more pessimistic scenario (with R0 for Delta increased by 55% not 30%), then we get something like this. Note the triple wave is initiated by Delta/Step 3, then lifted by Step 4, and then lifted again by schools/unis returning in September. 24/
In this scenario, there isn’t much happening in Spring 2022, because the larger wave in 2021 means we’re already at the herd immunity threshold (HIT) for Delta or thereabouts, and so when we open up fully and return to normal behaviour, very little happens. 25/
We get a very similar shape if, instead of the higher transmission gain, we instead assume that Step 4 is larger than I normally assume – so instead of returning to ~75% of normal risk levels, we return to ~90% of normal risk. Then the graph looks like this: 26/

Again, hospitalisations peak in Sept/Oct, at about half the levels of the peak in January 2021. [and for everyone who’s about to reply “hospital stays are shorter now, so admissions don’t matter so much”: yes, that’s true. But I think the evidence 27/
https://twitter.com/nicfreeman1209/status/1406506033414033408?s=20
.. suggests that the change is a reduction of ~25%, which is significant but not transformative. And I also note that even if a hospital has plenty of ICU and other beds available, it’s still a problem if there are long queues at A&E or no ambulances to get people there.] 28/
So, neither of those downside scenarios (higher Delta transmission, and larger Step 4) gets close to overwhelming the NHS – although either would be unpleasant. The combination of the two would be worse, but I consider that very unlikely, because it would require 29/
…Step 3 to be less ‘open’ than I think, and Step 4 to be more open – so the change from Step 3 to 4 would be very large (almost a doubling of risk levels), which feels implausible. So that’s slightly comforting, I think – even the downside scenarios are not catastrophic. 30/
So if that’s the case, maybe we could open slightly earlier, at the checkpoint on 5th July? And in my central case, that’s OK as well. The summer wave is only slightly higher (and again I’ll ask you to ignore the Spring 2022 wave for now – I promise we will address that). 31/

The problem is, in either of the downside scenarios (higher Delta transmission or larger Step 4), the earlier opening on 5th July does threaten to create bigger issues. Now we have a summer wave with the peak of hospitalisations getting closer to the Jan 2021 peak levels: 32/

Others may disagree on this, but I’m not confident enough in ruling out those downside scenarios, or on the exact scale of them, to advise opening up on 5th July. My advice would be to stick to the 19th July opening schedule, which has much more limited downside risks. 33/
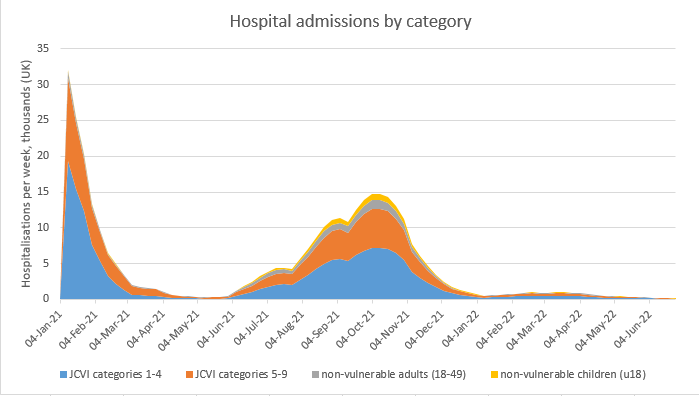
So in what follows I will assume that we are opening on 19th July, and that we’re in my central case, with R0 gain for Delta of 30% (not 55%). This is a reminder of the model’s outputs – and you’ll recall my promise to come back and address what’s going on in Spring 2022. 34/

The challenge is that in autumn 2021 the model predicts we’ll have just under 80% overall immunity, slightly below the herd immunity threshold for Delta (of ~85%). So we still need to get some immunity from somewhere – and if we open up fully, it will come from infection. 35/
Of course, there’s a million and one things that could change between now and the autumn, and so it’s wrong to try to optimise strategy that far ahead. But if we *did* end up in that situation, the obvious answer would be to find some more people to vaccinate. 36/
This could be finding adults who’d declined the offer previously, or giving booster vaccines to everyone (and so increasing overall immunity levels). Another route would be to offer vaccines to 12-18 year olds, and if we did do this, it has a significant impact: 37/

Now the Spring 2022 wave looks much more similar in magnitude to the Summer 2021 wave, and much less scary from the perspective of NHS capacity. So, if we need to find a few more % points of immunity in the autumn, it looks like there are ways of doing that. 38/
But it may turn out it’s not necessary. Regular readers will recall that I did some work a few weeks back on heterogeneity effects around both vaccine and infection-acquired immunity – see the thread below. 39/
https://twitter.com/JamesWard73/status/1391514744360775682?s=20
If I turn the ‘heterogeneity’ switch on in the model, with a plausible adjustment factor of 1.5 for infection-acquired immunity (and being careful to match to current conditions), it also has a big impact: the wave in autumn/winter 2021, and Spring 2022, is mostly removed. 40/

We should know by mid/late August if that’s what’s happening, and so will be able to judge whether we need to add in vaccination of teenagers (or other extra vaccinations) to avoid problems in the winter. There’s just one final point I want to consider: seasonality. 41/
We used to consider seasonality as our potential saviour: it would make things better in the summer. But now we’re in the summer, and we’ve got some (hopefully not all) of the benefits of warmer weather already, it starts to become more of a potential downside risk. 42/
Some recent work has suggested that peak-to-trough variation in R0 might be closer to 40% than the 20% I currently assume. But there are also reasons to think that may be over-estimated for the UK, so let’s try a compromise of 30% variation: 43/
https://twitter.com/jankulveit/status/1404369971334070273?s=20

This has a Spring 2022 wave exceeding the Jan 2021 peak of hospitalisations, which is only partly mitigated by vaccinating teenagers (left hand graph), or more so if we assume benefits from heterogeneity (right hand graph). So seasonality may not be our friend. 44/


Again, this highlights the craziness of trying to predict dynamics 6-9 months ahead: there’s so much we still don’t know about this virus, and so much that could change between now and then. But having an idea of the potential range of scenarios is still useful, I think. 45/
I should also apply the usual caveats: my model doesn’t deal with waning immunity, or with booster vaccines in autumn 2021, or with any new variants beyond Delta. And it doesn’t have the age-group or regional structure that the more sophisticated SPI-M models do. /end
PS for those of you who like tables of numbers, here’s another one to add to the collection; the scenarios are those shown in the graphs above (with just one addition).

PPS a few people have also asked for an updated table of assumptions, so here goes (in two parts):


• • •
Missing some Tweet in this thread? You can try to
force a refresh


