Update on COVID hospital admissions and deaths in England.

Admissions are rising sharply again after a few days of slower increases. The recent growth rate implies a doubling time of around one month.

As ever the regional analysis (below) helps explain the national picture. 1/4
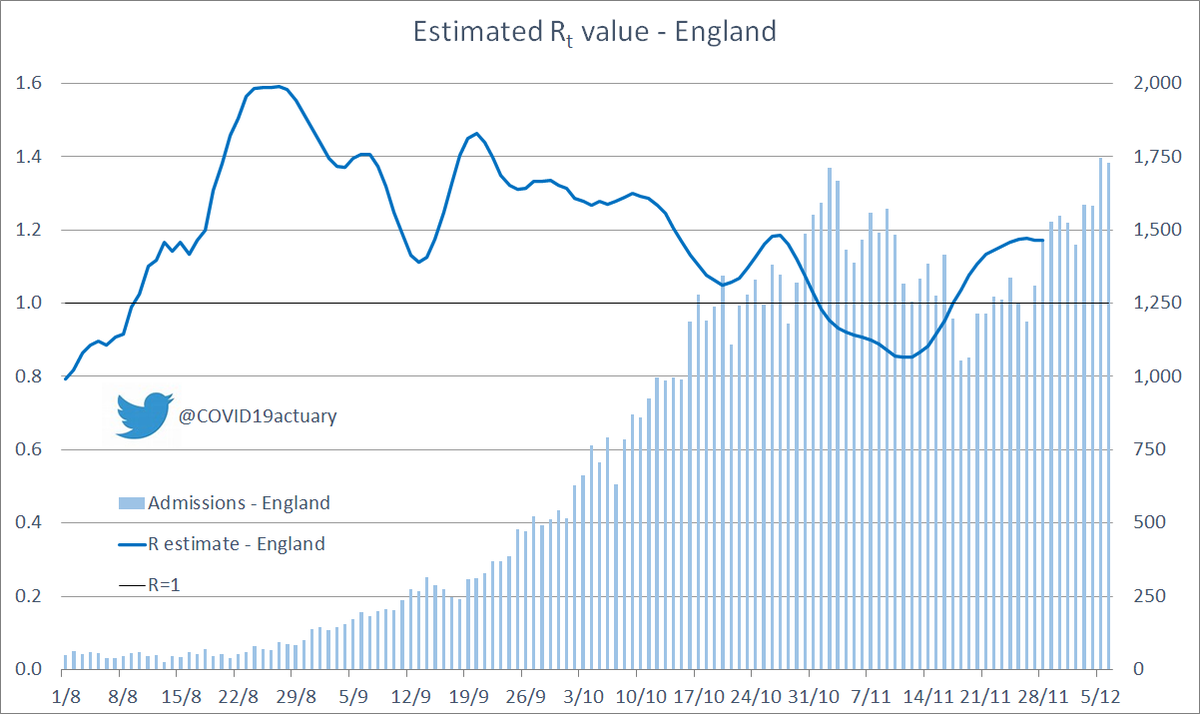
This chart is an “R-like” estimate based on hospital admissions.

With a reducing proportion of infections turning into admissions, this probably understates R slightly.

This shows that the rate of increase in admissions had been falling, but is now increasing again. 2/4
Looking at the regions, it’s NE & Yorkshire and the Midlands driving the national growth, with South East and South West also increasing rapidly but from a lower base.

North West and London both look flat over the week but the pattern was a short term dip then an increase. 3/4
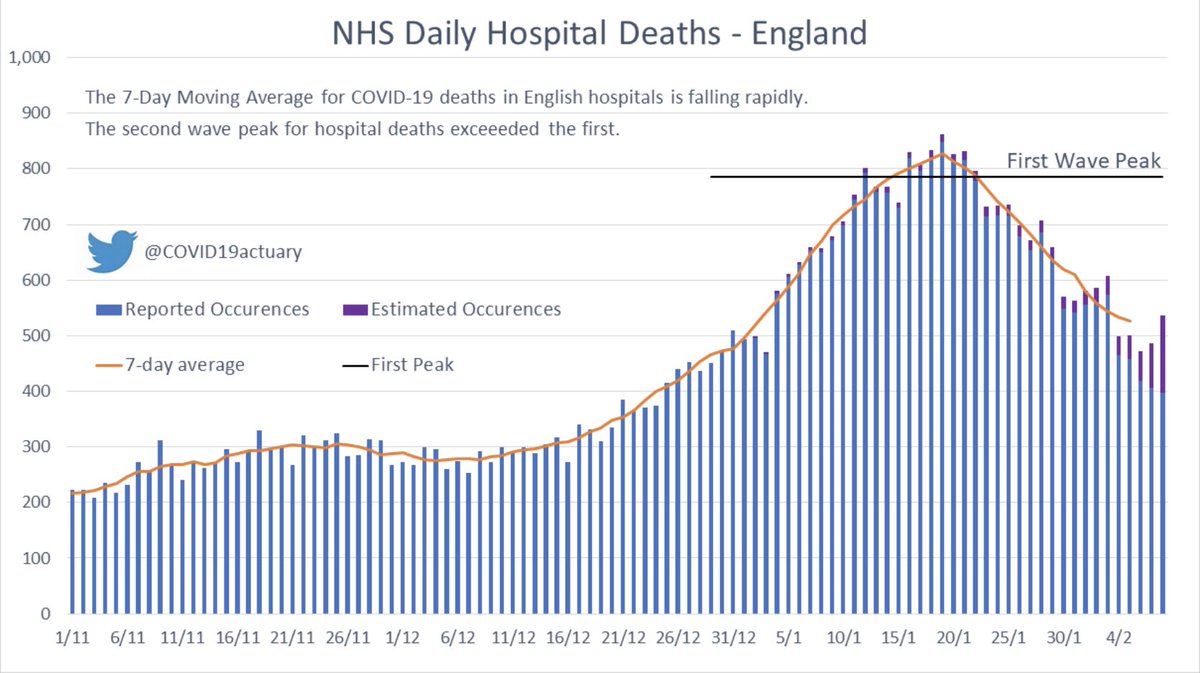
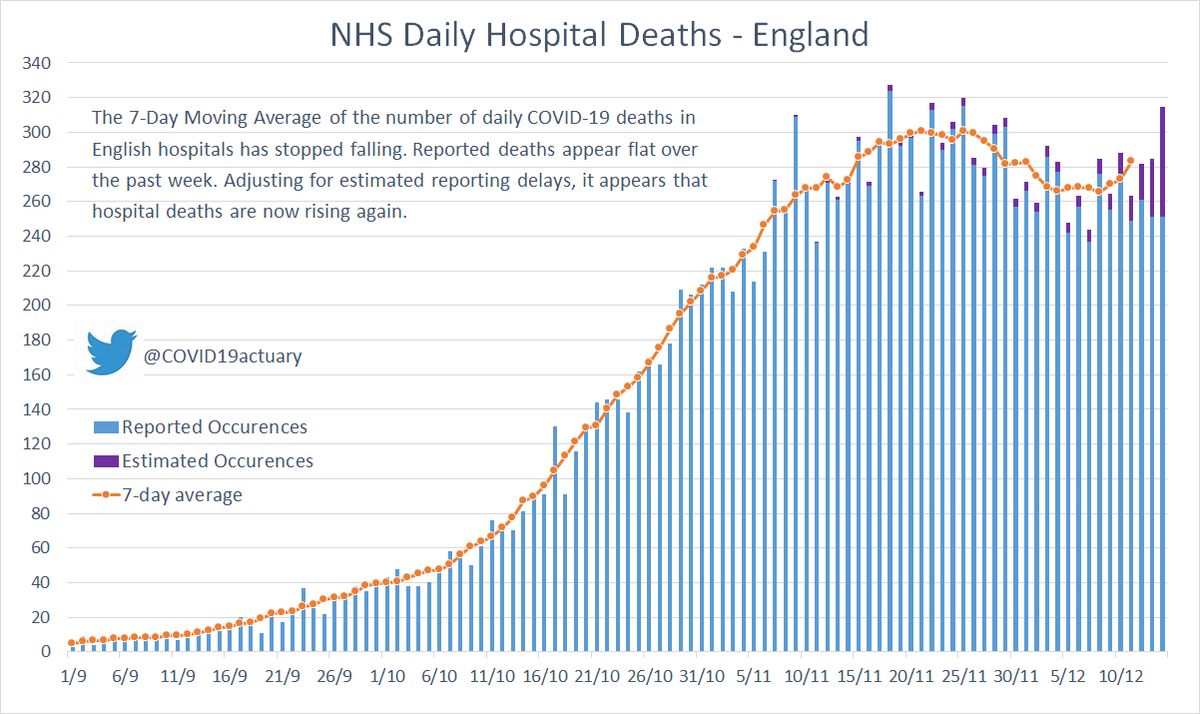
Daily hospital deaths are still very low so the daily numbers are volatile but it’s clear these have been trending up over the last three weeks.

The purple estimates are based on the pattern of reporting delays in the last two months. 4/4

• • •

Missing some Tweet in this thread? You can try to force a refresh
 

Keep Current with COVID-19 Actuaries Response Group

COVID-19 Actuaries Response Group Profile picture

Stay in touch and get notified when new unrolls are available from this author!

Read all threads

This Thread may be Removed Anytime!

PDF

Twitter may remove this content at anytime! Save it as PDF for later use!

Try unrolling a thread yourself!

how to unroll video
  1. Follow @ThreadReaderApp to mention us!

  2. From a Twitter thread mention us with a keyword "unroll"
@threadreaderapp unroll

Practice here first or read more on our help page!

More from @COVID19actuary

28 Jun
As South Africa announces new restrictions in the face of a resurgence of cases, @lrossouw compares the third waves emerging in SA and the UK. Both countries face a sharp increase in cases, but SA also has surging hospital admissions, and excess deaths.
covid-arg.com/post/a-tale-of…
The delta variant now looks dominant in both countries, though sequencing in South Africa is more limited.

The difference between the UK and SA third waves is vaccines, with minimal rollout in SA. With so few people vaccinated, more caution could have been applied before now. Image
In May 2020 the worst scenario projected by @imperialcollege showed 216,000 deaths in South Africa. With 173,000 excess deaths to date, and a severe third wave underway, that figure might be exceeded this year. Image
Read 6 tweets
11 Feb
Thursday update on COVID-19 hospital admissions and deaths in England continues to show an improving picture.

7-day moving average for hospital admissions continues to fall. Possible sign that fall may be accelerating - vaccines?

The regional picture is analysed below. 1/4 Image
Our estimate of R, based on hospital admissions is at 0.73 and looks like it may be starting to fall further. That will be a sign that vaccines have broken the link between infections and admissions and it’s time to discontinue this approach to R estimation. 2/4 Image
Hospital deaths are falling rapidly and are now well below the first wave peak. 3/4 Image
Read 4 tweets
17 Dec 20
Our latest update on England admissions and deaths sees the 7 day MA for the former now above the previous second wave peak in mid Nov, and the current rate of growth is equivalent to a doubling time of around a month. There's considerable regional variation, covered later. 1/4
Our estimate of R, based on admissions, may be levelling off at just under 1.2. As already noted though, this would imply doubling approximately every month, so is not a sustainable position at the current high level of admissions. 2/4
For deaths, after a few days where the 7DMA had levelled it has now clearly started to increase again, which is to be expected given the trend in admissions. Unfortunately we can expect this to continue and it is likely to reach a new second wave peak during the Xmas week. 3/4
Read 4 tweets
15 Dec 20
Latest data on COVID-19 admissions and deaths in English hospitals.

The 7-Day Moving Average for hospital admissions is rising rapidly again nationally. Doubling time is around a month.

As ever, the regional picture (below) is key to understanding the national picture. 1/4 Image
Based on recent hospital admissions we estimate that R was approaching 1.2 for England as a whole in late November.

As ever, we would emphasise that this is a composite of different regions with different trends in infections. 2/4 Image
The average number of COVID-19 deaths in English hospitals still appears to be slowly falling.

We’ve seen fewer late-reported deaths than anticipated in our Saturday update, so it no longer seems like deaths have stopped falling nationally. 3/4 Image
Read 4 tweets
12 Dec 20
Latest data on COVID-19 admissions and deaths in English hospitals.

The 7-Day Moving Average for hospital admissions is rising rapidly again nationally. Doubling time is around a month.

As ever, the regional picture (below) is key to understanding the national picture. 1/4
Based on recent hospital admissions we estimate that R was above 1.1 for England as a whole during late November.

As ever, we would emphasise that this is a composite of different regions with different trends in infections. 2/4
The average number of COVID-19 deaths in English hospitals also now appears to be rising again.

We adjust the data to allow for reporting delays (based on the recent pattern) which allows us to identify the change in trend earlier than other techniques. 3/4
Read 4 tweets
10 Dec 20
Latest data on COVID-19 admissions and deaths in English hospitals.

With admissions above trend, the 7-Day Moving Average for hospital admissions is rising again nationally.

As ever, the regional picture (below) is key to understanding the national picture. 1/4 Image
Based on recent hospital admissions we estimate that R went back above 1.0 for England as a whole, during the second half of November.

We again emphasise that this is a composite of different regions with different trends in infections. 2/4 Image
The average number of COVID-19 deaths in English hospitals is still falling, having peaked at around 300 deaths a day.

We expect this will continue follow admissions, which means further falls in the short term, but increased admissions may be replicated in the deaths too. 3/4 Image
Read 4 tweets

Did Thread Reader help you today?

Support us! We are indie developers!


This site is made by just two indie developers on a laptop doing marketing, support and development! Read more about the story.

Become a Premium Member ($3/month or $30/year) and get exclusive features!

Become Premium

Too expensive? Make a small donation by buying us coffee ($5) or help with server cost ($10)

Donate via Paypal Become our Patreon

Thank you for your support!

Follow Us on Twitter!

:(