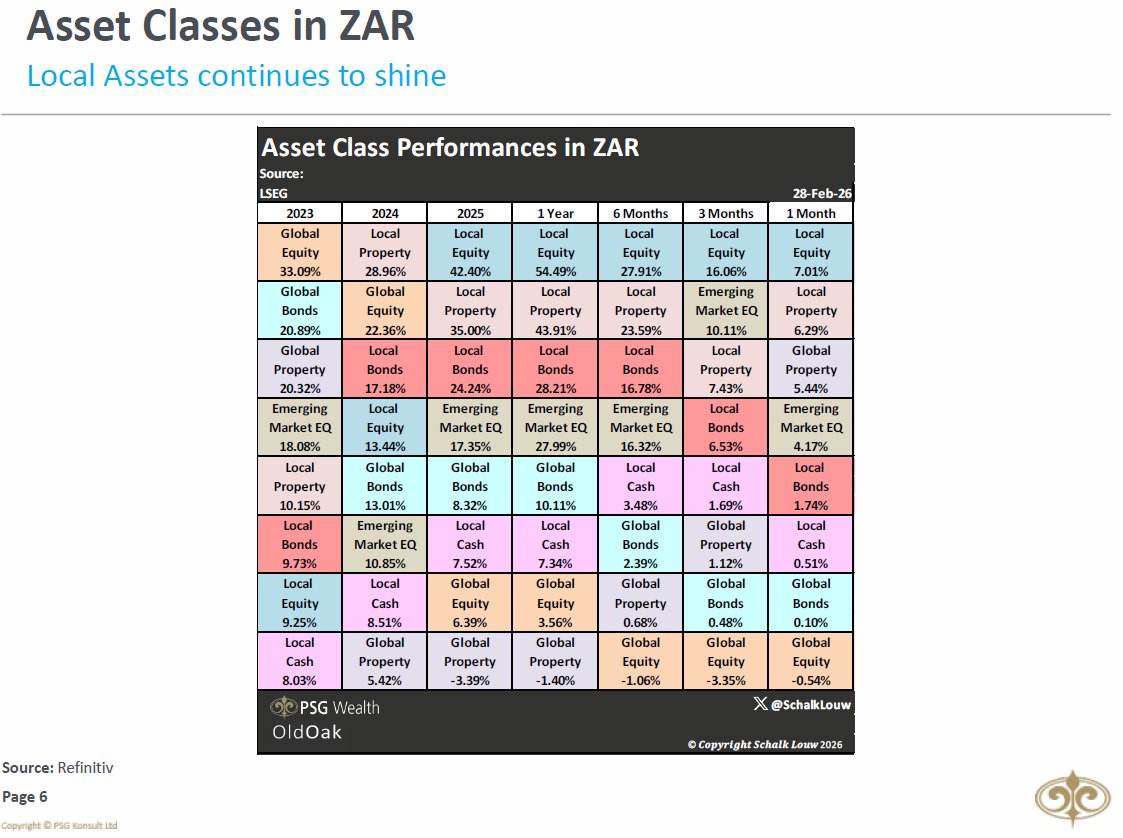
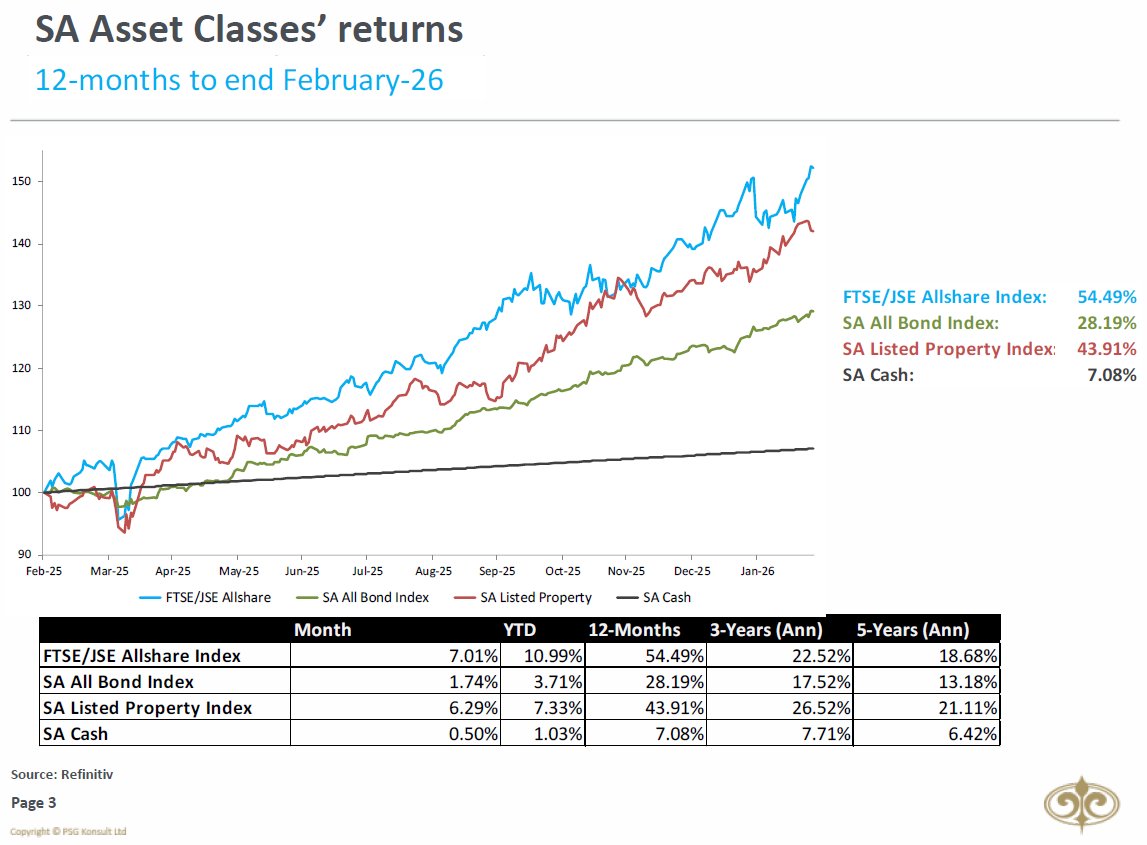
UPDATE ON MARKETS: BIG breather from all things SA. FTSE/JSE All Share retracted by 2.4% during June, bringing year-to-date returns to 13.2%. SA Property stocks had a great recovery, increasing 3.4%. Despite having net foreign selling pressure, SA All Bond Index increased by 1.1% 

2/9
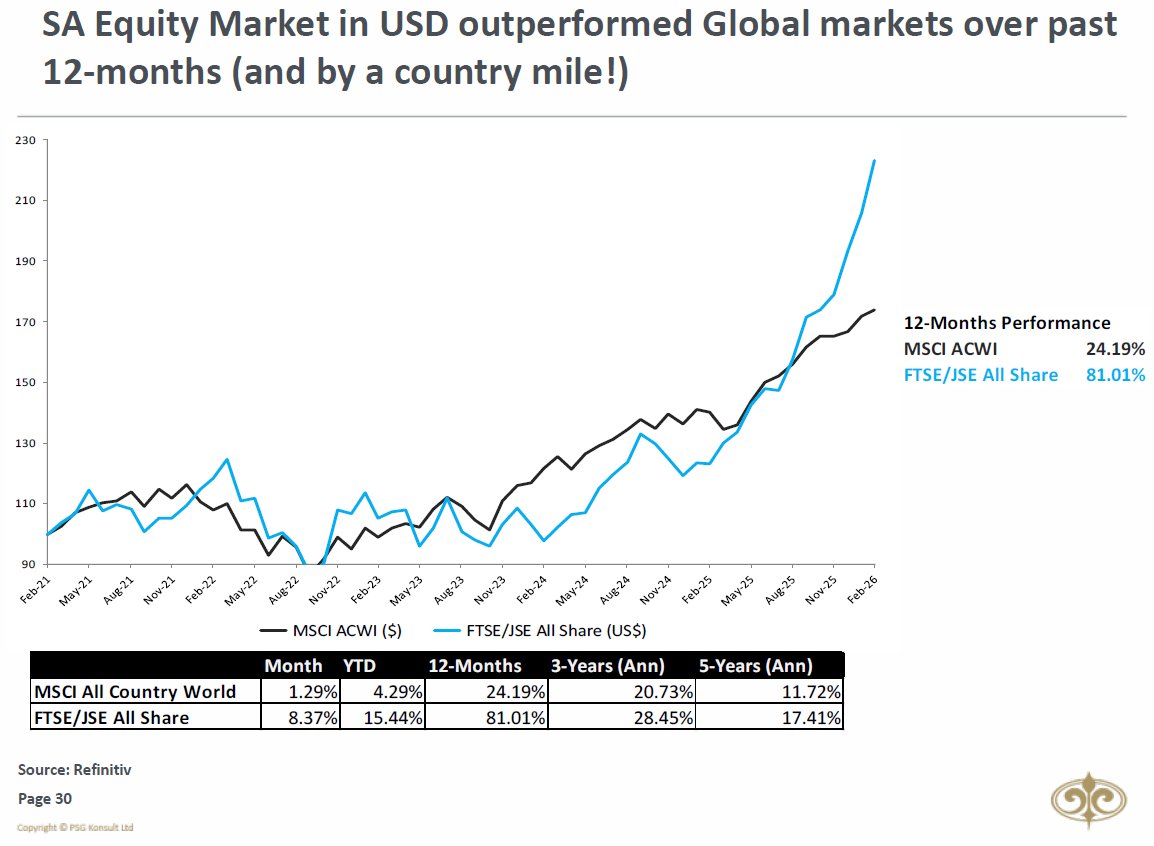
Massive underperformance by the FTSE/ JSE All Share (-6.2%) versus the MSCI All Country World Index (+1.32%) in USD-terms. The 12-month performance for the JSE in USD terms still leads the MSCI ACWI’s performance by nearly 13%.
Massive underperformance by the FTSE/ JSE All Share (-6.2%) versus the MSCI All Country World Index (+1.32%) in USD-terms. The 12-month performance for the JSE in USD terms still leads the MSCI ACWI’s performance by nearly 13%.

3/9
South African Small-Caps were less affected during June, declining by only 1%. Large Caps and Mid-Caps both declined by 2.6% respectively.
South African Small-Caps were less affected during June, declining by only 1%. Large Caps and Mid-Caps both declined by 2.6% respectively.

4/9
Foreigners were net sellers of both South African Equities and Bonds in June.
Foreigners were net sellers of both South African Equities and Bonds in June.

5/9
From a sectoral point of view, the biggest culprit for the decline came from the Resource Sector (-6.6%). Gold miners were the biggest loser in terms of attribution (compared to Capped Swix).
From a sectoral point of view, the biggest culprit for the decline came from the Resource Sector (-6.6%). Gold miners were the biggest loser in terms of attribution (compared to Capped Swix).


6/9
Rand’s value devalued by whopping 3.9% against USD in June. This was mainly USD strength as it devalued by only 0.8% against Euro & 1.1% against British Pound. Rand was also worst-performing BRICS currency in June, but maintained its number one status over a 5-year period.
Rand’s value devalued by whopping 3.9% against USD in June. This was mainly USD strength as it devalued by only 0.8% against Euro & 1.1% against British Pound. Rand was also worst-performing BRICS currency in June, but maintained its number one status over a 5-year period.

7/9
The US M2 Money Supply YoY growth rate tapered off somewhat in May, helping the US Dollar to the detriment of Gold.
The US M2 Money Supply YoY growth rate tapered off somewhat in May, helping the US Dollar to the detriment of Gold.

8/9
The US Dollar Index saw its best levels since the beginning of April 2021 and now trades above both its 200-day and 50-day Moving Averages.
The US Dollar Index saw its best levels since the beginning of April 2021 and now trades above both its 200-day and 50-day Moving Averages.

9/9 & Final
Most commodities saw quite a bit of a selloff during June. Brent Oil however increased by 8%! Copper decreased by 8.8%, while Gold decreased by 7.2%.
Most commodities saw quite a bit of a selloff during June. Brent Oil however increased by 8%! Copper decreased by 8.8%, while Gold decreased by 7.2%.

Unroll @threadreaderapp
• • •
Missing some Tweet in this thread? You can try to
force a refresh