Its a tad disconcerting that the CMIP6 multimodel mean (using the 41 unique models current available) for the scenario intended well-below 2C – SSP1-2.6 – gives more than 2C warming by 2100:
That said, there are reasons to somewhat discount some of the very high sensitivity models that drive the overall multimodel mean upwards since CMIP5: thebreakthrough.org/issues/energy/…
Lots of other recent papers making this point:
Correction: 40 SSP1-2.6 models, and it should have read "the scenario intended to be well-below 2C".
• • •
Missing some Tweet in this thread? You can try to
force a refresh
Today the media is reporting on leaked Second Order Drafts of the IPCC WG2 report, due out in early 2022. I won't comment on the substance of the draft, apart to note that substantial revisions are often made between second order and final versions of the report.
There is a real risk or misrepresentation or inaccurate reporting based on leaked drafts, given that others cannot reference the original source. For example, @AFP is inaccurately reporting that climate change caused "crop production to fall 4%-10% in the last 30 years".
Global crop yields increased substantially over the last 30 years. At the same time, climate changes likely resulted in lower yield growth than in a world without climate change. But thats a much more nuanced claim than readers would assume the IPCC is making based on reporting.
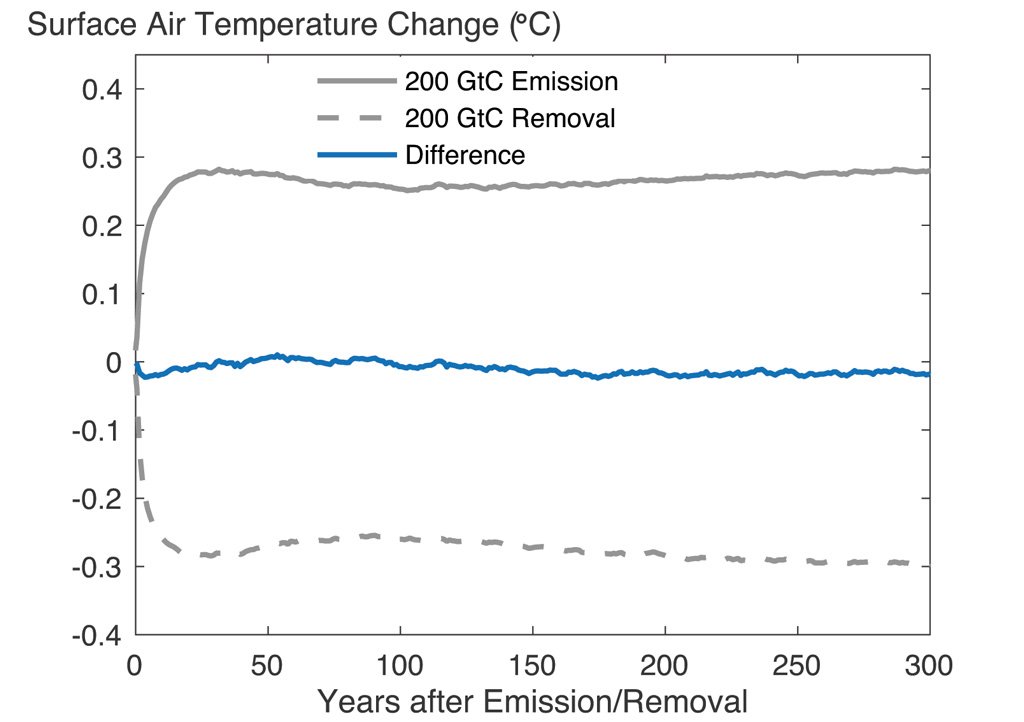
Great new paper by @KirstenZickfeld on the asymmetry of the effects on atmospheric concentration and temperatures between carbon additions and removals. She has an accessible explainer of the findings over at @CarbonBrief: carbonbrief.org/guest-post-why…
In short, they find that removing CO2 from the atmosphere is 3% to 18% less effective at reducing concentrations than adding it was in the first place, becoming less effective as more is removed. Thankfully the asymmetry for temperature are smaller – only 2% to 7% less:
None of this should suggest that carbon removals are not effective or needed; even if they were 20% less effective (at the extreme) than emissions additions, they would still be key to offset a long tail of hard to decarbonize activities.
The last 12 months have been the driest period in the Western US since records began in 1895.
In a typical year the the western US gets around 17 inches of rain on average. Over the last 12 months we have only gotten 8.7 inches.
During the same period, the region has warmed nearly 2C, with nearly all of that warming occurring in the years since 1970. Warmer temperatures dry out soils and vegetation, and helps drive the catastrophic wildfires we have experienced in the past few years.
While there is a clear link between climate change and heavier (if at times less frequent) rainfall, the links between average precipitation and climate are more complex. For details, see my @CarbonBrief explainer: carbonbrief.org/explainer-what…
First, you suggest that our @Nature paper says "fossil fuel emissions would be about 25 Gt by 2100, under assumed 2019 policies and technologies." We argue that current policies (as reflected by the 2019 @IEA WEO) implied around 3C warming (similar to SSP2-4.5 or SSP4-6.0). 2/4
We did not, however, imply that the particular emission pathways in SSP2-4.5 or SSP4-6.0, which are characterized by near-term emission increases or late-century emissions declines are implied by current policies. Flat emissions are arguably more consistent, but who knows! 3/4
May global temps are out for the @CopernicusECMWF ERA5 dataset. It was the 5th warmest May on record, after 2020, 2016, 2017, and 2019.
May temperatures have risen around 0.7C in the past 40 years, and was 1.2C above the temperatures of the late 1800s. climate.copernicus.eu/surface-air-te…
With five months of the year under our belt, I estimate that 2021 will likely be somewhere between the 4th and 7th warmest since records began, and will be well in-line with the long-term warming trend:
Here is how my forecasts of 2021 temperatures from ERA5 have evolved as each month of the year has come in (and the ENSO forecast has been updated):
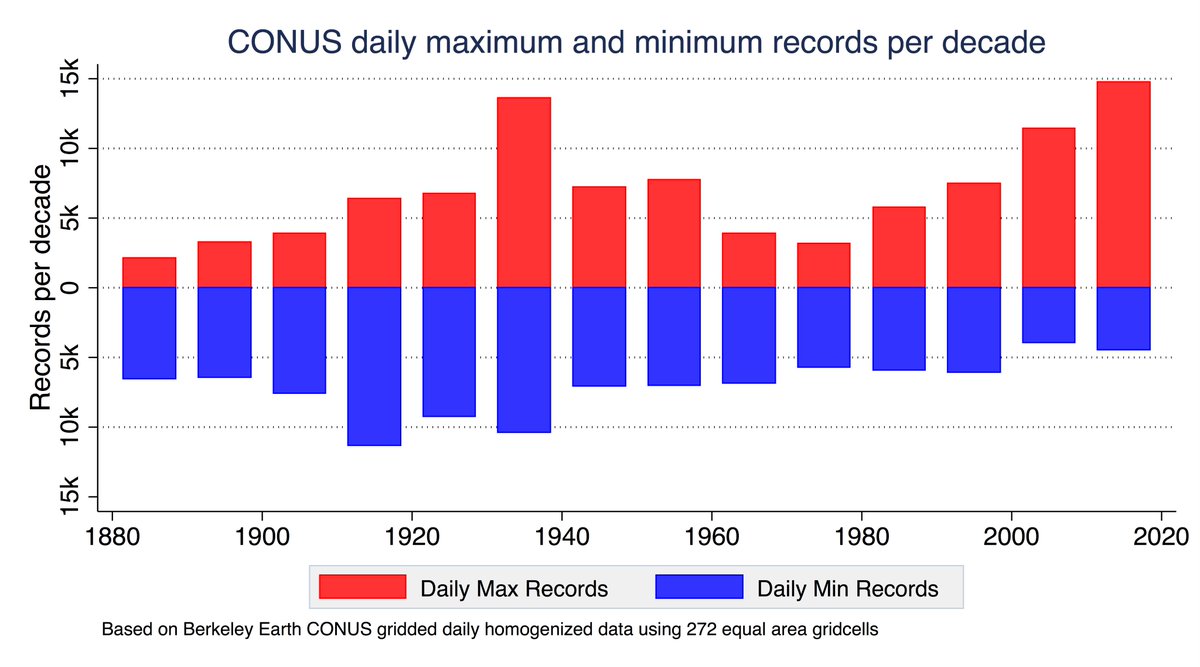
We often look at monthly or annual climate datasets, but daily data matters a lot for studying extremes. Using @BerkeleyEarth daily homogenized gridded data, I took a look at how the number of daily maximum and minimum records has changed over time:
To calculate how the number of records have changed over time, I looked at when the record low and high daily temperature over the 1880-2019 period was recorded in each grid cell for each day of the year, resulting in 365 days * 5498 gridcell max and min records.
If we look specifically at the contiguous US (e.g. excluding Alaska and Hawaii), we see a more pronounced set of 1930s daily maximum records corresponding to the dust bowl, but also see that the past decade (2010-2019) has set more daily maximum records.