
Sat, winter, rain, lockdown, ex auditor, accountant, plenty of coffee and youngest watching @STVYouTube on repeat. Oldest in his @Minecraft bunker. Partner sorting washing. You have my undivided attention @NDIS @EveryAustralian #ndis #auspol #HandsOffOurNDIS
https://twitter.com/NDISDeane/status/1411091042410008585
1/ context key as report doesn’t address cohort of people with disability not on the scheme and does not speak to success of any such scheme also contingent on policy and outcomes in other parts of life of a person with disability eg education, housing, employment #WholePerson
2/ this report also doesn’t address any gaps in support or spending that impacts or undermines scheme spend eg poor educational experience isn’t compensated by NDIS paid therapy. Inaccessible public housing stock not fixed by house mods paid by NDIS. #IncludeUsFromTheStart
3/ also does not examine generations of under investment in health outcomes & youth justice. This report also assumes that current services and supports are culturally safe or appropriate for all. They are not. Report does not address gender bias of #NDIS #ContextIsKey
4/Comparisons: looking at financial performance of #NDIS what should you compare it to? For a listed company you compare to their own budget and prior years actual results. You examine the assumptions built into the budget and the accounting used to calculate actual figures.
5/ look at values they have applied to things like buildings. You question how they come up with figures and compare those to other similar items. You look at Known Knowns and known unknowns (sorry Rumsfeld). As if it’s a used car and who drove it how often how many accidents.
6/ this sat delight compares scheme figures against PBS portfolio budget statements. That’s those things each year formulated at Dept level and distilled via Treasury. Ones that hold big figures and little public detail. Lots of weight and very light on how calculated. #NDIS
7/ is that a fair comparison? The scheme has an independent board, a quality and safeguarding commission, it’s own actuary, a regular slot at admin appeals tribunal and at the moment @DRC_AU. The Productivity Commission has had a regular look at it. But the @ANAO_Australia ?
8/ more on comparisons later. p16 report acknowledges that also important to look at outcomes as well as financial cost. BUT who decides what outcomes are measured and what weight can be given to them in scheme sustainability? #NDIS
9/ Currently “outcomes” come from surveys completed by participants (some), nothing from non participants, and lots of pretty graphs on participant budget and payments. Scheme is less than 10 years old but no movement on better measures of scheme outcomes. #NDIS
10/ Are Australians good at evaluation of public policy and programs? The APS (Aus Public Service) writes itself regular reports & guidance on how to set up evaluation from the start. Some good examples of evaluation but less than stellar delivery Eg Closing The Gap or AEDC
11/ Many of the issues raised in recent submissions on #NDIS by @CydaAu or @WWDA_AU or @PWDAustralia or @FPDNAus aren’t dealt with in current outcome measures eg cultural fit for purpose or gender bias. Things that have lifelong impact on people. Yep those pesky participants
12/ There is a measure of who leaves the scheme and satisfaction (for some) but no measure for those who can not summon the will to fill in a survey because they are worn down, broken and tired. #NDIS
13/ as the scheme has been trialled and rolled out across an uneven and bumpy landscape and the world outside the scheme has evolved independently, comparisons become less and less reliable. For example South Australia trialled early on all kids under 14. Those kids are now 7-19.
14/ 42% of participants nationally are under age 14 and 29% of all participants are under 14 and male. Tables E14 & 16 in Quarterly report. So what outcome measures look at the experience over time of young male South Australians? Scheme satisfaction and spend of their plans?
15/ If I was looking at scheme sustainability for young males in a smaller state I’d want to know about shift in types of services and supports over life course. I’d want to be able to see goals evolve across education, community involvement, health and employment.
16/ I’d want to be able to talk about scheme sustainability in the context of South Australian education achievement, career counselling take up, accessible housing spend, health stats, youth justice numbers and other life outcome measures for scheme participants.
17/ anyhoo optimism. Back to the report. So emphasis that work on participant experience & slow numbers at start up meant that the finances of the scheme came in under budget early on. Let’s call it as it was/is. Money spent on paper shuffle but not supports for participants. Ok.
18/ then (cue music) 2019-20 the Govt budget was exceeded by 8%. I’m using % because anytime you use the word billion public perception goes “woah! Billions?!?” But nobody asks if Govt budget was sound to start with or if it was budgeted to spend $ on stuff that was useful.
19/ page 18 table 4 - yes we will be here a while & you are getting it real time. And youngest is now watching Minuscule. Actual participant costs vs PBS over financial years - under and over spend. I want an overlay of consultant spend and participant numbers expected vs actual.
20/ comparing billions underspend from one year to another year implies the assumptions underlying column A and column B were accurate AND appropriate or to use #NDIS terms - reasonable and necessary eg staff caps, LAC underperformance and wait times for tribunals & suppliers.
21/ table 5 compares an estimate reported in 2017 on the basis of a scheme running differently to what we actually have to a Govt budget story with an agenda of cuts and roboplan. Sorry I mean PC to PBS. Relevance to current actual scheme experienced by people and one they want?
22/ Bottom of P18 “cos COVID mate”. Again failing to examine relevance of measures taken during COVID to actual participant experience and outcomes. Providers got comms 1st, flex across core & capacity helped some, PPE prioritised workers for some. $ spent with what impact?
23/ Limitations of this report “..it is difficult to interpret future expenditure based on past experience, meaning there is significant uncertainty in the projection.” P19 @lukehgomes @SquigglyRick so who will rely on it to cut and roboplan?
24/ “..the lack of a mechanism for robust assessment of support need..” Each current participant has at least been required to supply evidence of diagnosis, personal goals, reports to justify services and supports. Those young South Australian men have had at least 4 plan reviews
25/ page 20 fails to address the impact of an ineffectual National Disability Strategy, continued investment in segregated settings and ineffective DDA, Disability Standards for Education and the DSP’s role in letting down people with disability. All those cost $ good or bad.
26/ “…the Agency is building one of the most comprehensive, longitudinal data sources on disability in the world.” P21 Excuse me? Of one aspect of a person’s life with no regard for whole of life or life course, educational outcomes, health status, etc etc #InsertExpletiveHere
27/ p21 sources of data used and nice table and some notes BUT level of function for example has been known to have issues since 2017. 4 years later still using this data. #NDIS
28/ modelling approach assumes that use of primary disability and split out of SIL will provide a story about sustainability. Are people more complicated than this? Yes. Can any model cover every variable and still arrive at a conclusion? No. Is there something better in between?
29/ why is SIL and primary disability as key characteristics dangerous? How are those things weighted or not? You fall into the same traps if you use the current GST allocation to states as a base to decide should the GST rate go up? Too much for a Saturday Twitter analysis?
30/ participant numbers: how they arrive at bums on seats. Issues? Two genders only, age groups, primary disability and level of function are used to profile real people into “2,052 unique Projection Groups”. Incidence of disability and previously unmet need pad out the numbers.
31/ not written but implied is idea that PwD emulate development or life trajectory prescribed without consideration of their disability. My experience of my child tells me she doesn’t give a hoot what the model says, she’s charting her own way with her disability. #AbleismSucks
32/ not touching SIL assumptions except to say that there is no analysis of effectiveness of current arrangements and external forces on those arrangements. #StayingInMyLane
33/ inflation numbers used….. you can only go with what is out there BUT how do prior changes in price guides and plan values compare to inflation actuals etc etc? How have prices tracked, how have price changes impacted plan values and how does that compare to payments made?
34/ “An allowance for the expected change in participant plan provision is then made to convert projected costs from a cash basis to an accrual basis.” Cash/accrual is timing thing normally. Eg pay $120 for annual sub which is cash expense but accruals wise that’s $10 a month.
35/ but that word salad? I don’t know. Maybe more later? Page 25 pretty pic. Tags mainstream interface as one element of ‘uncertainty of scheme experience’. people who craft PBS also craft much of that. A little less uncertainty will help sustainability. Maybe the NDS could help
36/ and why are agency pricing decisions under uncertain? P26 para 2 says estimates used in the budget were based on projections and some big changes were made to projections eg number of kids. So if you compare actual to budget remember we made changes to our own numbers. Yep.
37/ “.. greater number of participants with autism, developmental delay and psychosocial disability have entered the Scheme than expected, and a lower number with hearing and visual impairments..” and why would that be? Remembering that the categories are scheme constructed.
38/ participants info is funnelled into primary disability categories and function labels not used outside of scheme. Scheme construct assumes real people will follow scheme trends. Hmm what could go wrong?
39/ note 35 p28 “High, medium and low function is relative within the Scheme population and not comparable to the general population.” In other words we made these labels up to give our assumptions some uniformity but don’t try and take these out to the real world. Oh oops…
40/ page 31 pretty graphs about something the scheme categorised themselves and is tracking their own categories on data they knew in 2017 was flawed. Poo vs manure based on effluent. #NDIS helpful for participants? No. Useful in talking about scheme sustainability? No.
41/ “Prevalence is defined as the proportion of the general population that have a disability and are accessing Scheme supports” so not the same as prevalence of disability as it changes over time in the general population or related to any health statistics or longitudinal study
42/ “non-mortality exit experience in the 2020 calendar year (CY2020) has been volatile” why? And impact? And expected action to be taken? And what is the $$ associated with exits! #NDIS relevance?
43/ let’s have a pit stop here. I’m half way through the doc. Nothing yet tells me if they understand the trends and how scheme sustainability is so under threat when there is no projections on impact of proposed changes. #NDIS
44/ I’ve read the rest and have some overall thoughts for whoever is still with me. I believe the answers to scheme sustainability lie in what happened between the two lines. I’ve marked it with a purple skid mark. Yes I meant to say skid mark and yes I mean scheme purple. 
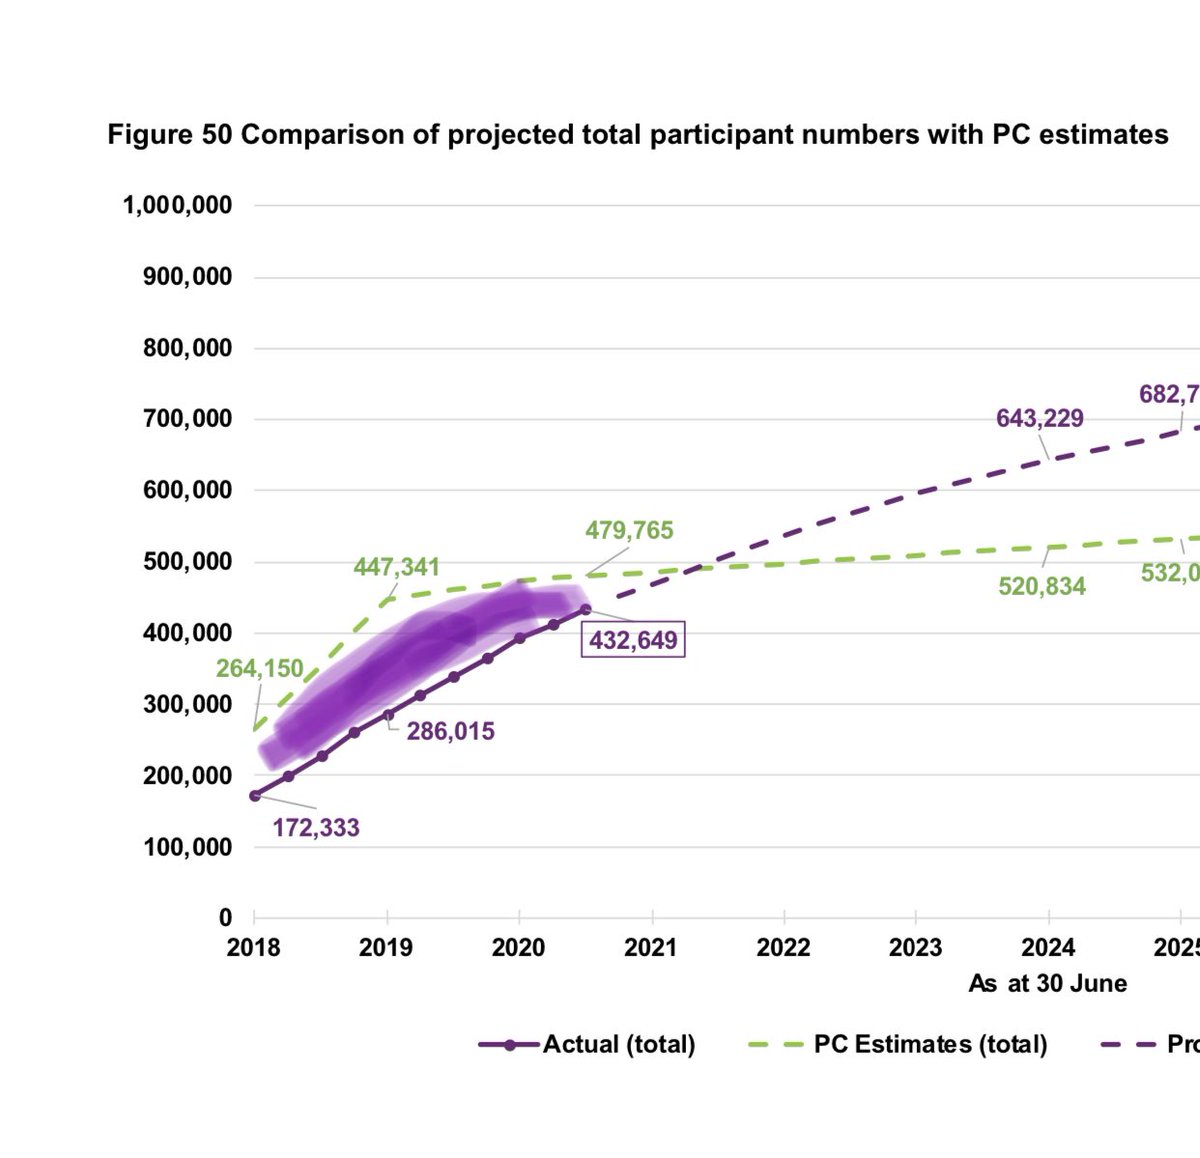
45/ participant numbers were lower than expected between 2018 and Dec 2021. Why? difficulty accessing, scheme not co-designed with some cohorts, staff caps, lack of people with disability employed, lessons from pilots leveraged? Etc etc. So scheme rollout flawed. #NDIS
46/ in other industries big schemes and investments require sensitivity analysis and contingency baked in. The report released today by #NDIS shows the calculation is no more sophisticated than [(participant numbers x average annual payments) + inflation %]
47/ but the people have been categorised and expected to behave according to variables assigned without any analysis of their elasticity. E.g what does life look like for people with spinal cord injuries and how does that relate to costs?
48/ How does a degenerative condition vary compared to say CP and Gow does that impact services needed? How does non NDIS experiences like school impact an autistic child vs diagnosis timeline vs parental capacity?
49/ How does increasing rates of digital interfaces impact the functional assessment of participants when the assessment tools don’t consider use of technology? How does a lifelong scheme account for changes in life?
50/ How does a low paid workforce with little job security in a variable not for profit or big business looking for profit market impact the success of such a scheme? How does an unregulated typically over inflated cost of equipment with no ACCC input impact sustainability? #NDIS
51/ How does a country riddled with geographic inequities (technology, health, education etc) think a National scheme baked over the top will be sustainable without addressing such inequality in scheme design not just the price guide? #NDIS
52/ How does such a scheme remain sustainable if it’s design and implementation accentuates gender inequity for participants, carers and workforce? How does a scheme survive if it doesn’t recognise more than two gender identities? #NDIS
53/ How can any political party speak to scheme sustainability and valuing people with disability if they continue to invest in segregation or ignore human rights violations?
The end.
And the rest of the thread
https://twitter.com/suetape/status/1411171557469130758
@threadreaderapp unroll
• • •
Missing some Tweet in this thread? You can try to
force a refresh


