As investors & companies globalize, we recognize that risk varies across countries for many reasons, and the need to incorporate that "country risk" into decisions. My seventh annual update on country risk is here: bit.ly/3ylZ8dK, with data here: bit.ly/3jEHP3m
1. Corruption: The roots of corruption don't lie in cultures, but in systems (over regulated regimes, with underpaid rule enforcers), but corruption is an implicit tax, and its effects varies widely across the world. Paper: bit.ly/3ylZ8dK & data: bit.ly/3jEHP3m
2. Violence: Operating a business in the midst of violence, from within or outside, is riskier than in peace. The threat of that violence is higher in some parts of world than others. Paper: bit.ly/3ylZ8dK & data: bit.ly/3jEHP3m
3. Property rights: For businesses to survive and thrive, property rights need to be enforced, and they are more strongly in some parts of the world than others. Paper: bit.ly/3ylZ8dK & data: bit.ly/3jEHP3m
Measuring country risk is complex, but entities do try. I use @PRS_Group measure of composite country risk to capture differences across the world. Paper: bit.ly/3ylZ8dK & data: bit.ly/3jEHP3m
Market measures of country risk are narrowly focused on lenders & investors, but they are correlated with other risk measures. My updated equity and country risk premiums from July 2021, with Moody's ratings. Paper: bit.ly/3ylZ8dK & data: bit.ly/3jEHP3m
Company exposure to country risk comes from where it operates. It is lazy & dangerous to assume that a company is only exposed to the risk of its country of incorporation. Paper: bit.ly/3ylZ8dK & data: bit.ly/3jEHP3m
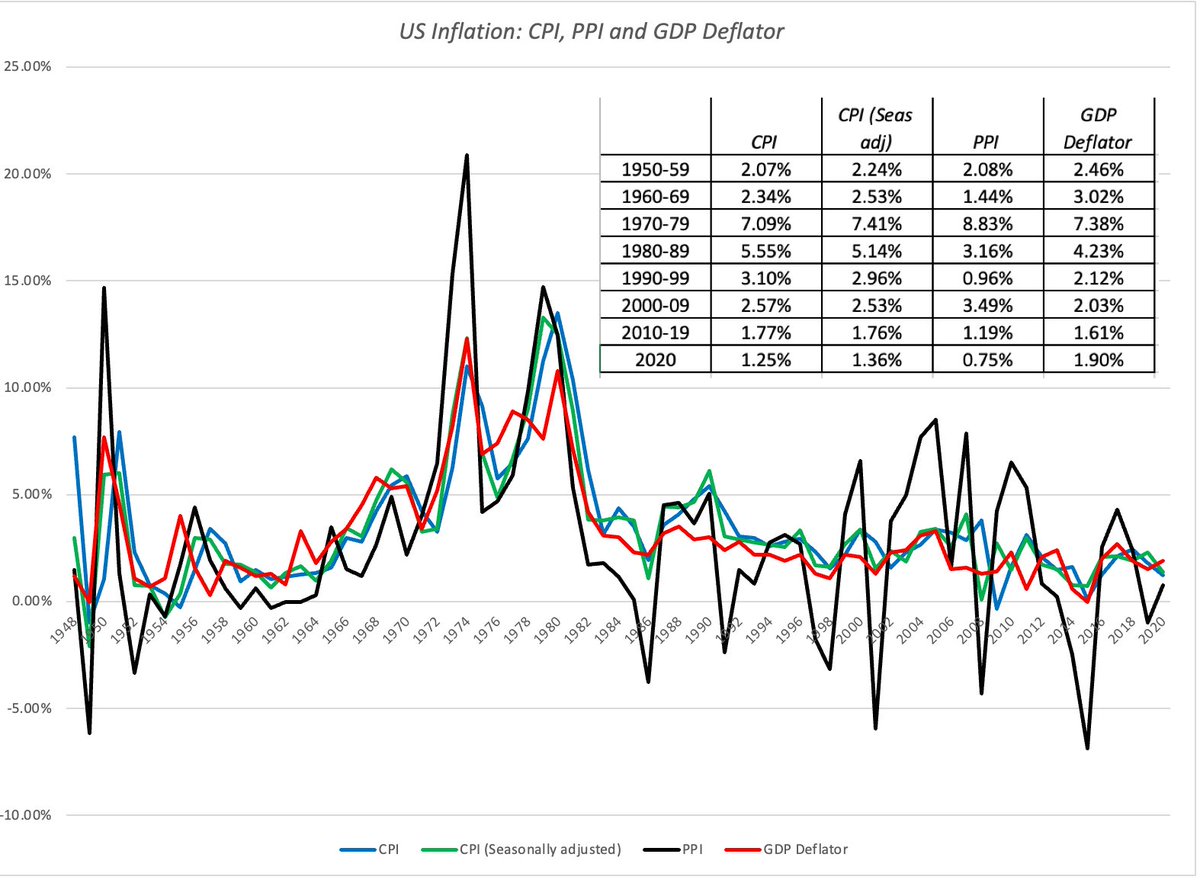
Currencies are more reflections of underlying risk, than sources of risk. Ultimately, it is inflation & real growth differentials that drive currency levels, changes over time and volatility. Paper: bit.ly/3ylZ8dK & data: bit.ly/3jEHP3m
• • •
Missing some Tweet in this thread? You can try to
force a refresh
We are drowning in data, sometimes manipulated and often misread. I am not a statistician, but that did not stop me from creating my own version of a statistics class, with a finance/investing twist. Webpage: bit.ly/3ziYHl6 YouTube Playlist:
Session 1: is an introduction to the components that make statistics the data science, from sampling to regressions. Full disclosure that I may be ignoring what some statistics classes view as indispensable, but so what? bit.ly/3ziYHl6
Sessions 2 & 2A: Most statistical sins are in the sampling phase, where bias, explicit or implicit, permeates the process and poisons conclusion. The notion that researchers are unbiased and objective is myth, and their priors drive their conclusions. bit.ly/3ziYHl6
While US stocks have done well, so far, in 2021, the market is caught between two forces, a stronger than expected economy as a positive and worries about inflation as a negative. After a decade of benign inflation, are we ill-prepared for the latter? bit.ly/2RLARxQ
Expectations that inflation will rise are becoming more broad based, as can be seen in both a bond market based measure (T.Bond - TIPs) and consumer surveys. bit.ly/2RLARxQ
Inflation is currency specific, & differences explain why interest rates vary across currencies and exchange rates. Here are expected inflation rates for 2021-26, by country, from the IMF. Given the noise in measuring inflation, take with a grain of salt! bit.ly/2RLARxQ
The second leg of the Biden tax plans targets the "rich", with a rollback in the 2017 rate cuts in the highest tax brackets and a doubling of tax rates on capital gains for the 0.3 percenters (making more than $ 1 million in investment income). bit.ly/3blbxp3
If historical stock returns in the US are adjusted for dividend and capital gain taxes, the tax impact wipes out almost 95% of the cumulative payoff. Paying a lower tax rate on dividends & trading less often reduces but does not eliminate the pain. bit.ly/3blbxp3
Prior to the tax rate change, investors are pricing stocks to earn an annual return of 5.73%, pre-taxes, and an after-tax return of 5.01%, with the current tax code. bit.ly/3blbxp3
The equity risk premium (ERP) is the price of risk in equity markets, the receptacle for all our fears. Each year, since 2008, I have updated a paper that includes everything I know about ERP. (Warning: It is 130 pages long...) Here is the 2021 version: bit.ly/2QQd3bB
As the ERP rises and falls, it drives what investors are willing to pay for stocks, and what companies demand as hurdle rates. Views on whether it is too high or too low determine whether stocks are collectively under or over valued. bit.ly/2QQd3bB
In practice, most analysts and companies estimate equity risk premiums by looking at the past (historical data), but that is not only backward looking, but it yields static and noisy estimates of the ERP, even for a market like the US, with a long history. bit.ly/2QQd3bB
As another corporate tax code rewrite looms, both sides of the debate will present opinions as facts. I look at how much US companies pay in taxes, relative to non-US companies. At 25-27%, US statutory tax rates are in the middle of the pack: bit.ly/3v2W9oT
But US companies pay less in effective tax rates than companies elsewhere in the world, largely because of the bloat in the US tax code. bit.ly/3v2W9oT
But the 2017 tax reform act rates is not to blame, for lower taxes. While effective tax rates dropped in its aftermath, taxable income increased, as did cash taxes paid. bit.ly/3v2W9oT
It is hard to believe, but a year ago, we were in the middle of a market meltdown, with no end in sight. My first post on the COVID crisis was on February 26, 2020 and my fourteenth post on the crisis was November 5, 2020. I gather these posts in a paper: bit.ly/3l442qq
If you are looking for an objective, theoretical perspective, this paper will disappoint you. It is data-driven, agnostic about theory, and personal, as I draw on my real-time posts to chronicle my ups and downs during 2020: bit.ly/3l442qq
As markets made their way back in 2020, I use company-level data to chronicle the winners and losers from the crisis, by looking at market cap and operating shifts during the year, and find that the flexible & the young won out over the rigid & the old. bit.ly/3l442qq