I'll try to explain this $DKNG 2-leg play for those who are confused
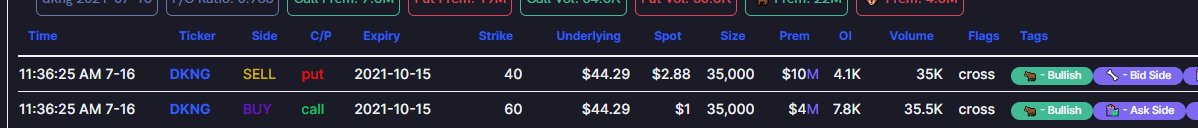
Sell 10/15 40p
Buy 10/15 60c
(if you are unfamiliar with writing/selling puts investopedia.com/trading/introd…)
Let's assume for simplicity's sake that we are dealing with 1 contract each, and not 35,000
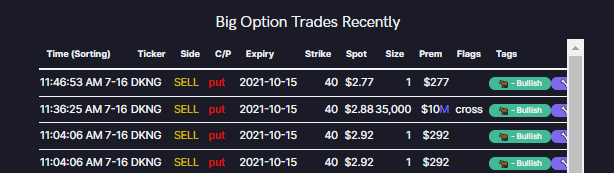
Selling the 10/15 40p nets this trader a premium of $288. With this $288 they buy the 10/15 60c for $100. This trader is pocketing $188 (288-100) & freerolling a 60c. The trade theoretically as unlimited upside & downside starts with $DKNG @ $38.12 (40p, minus the net 188 credit)
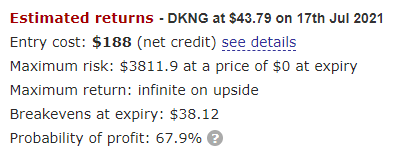
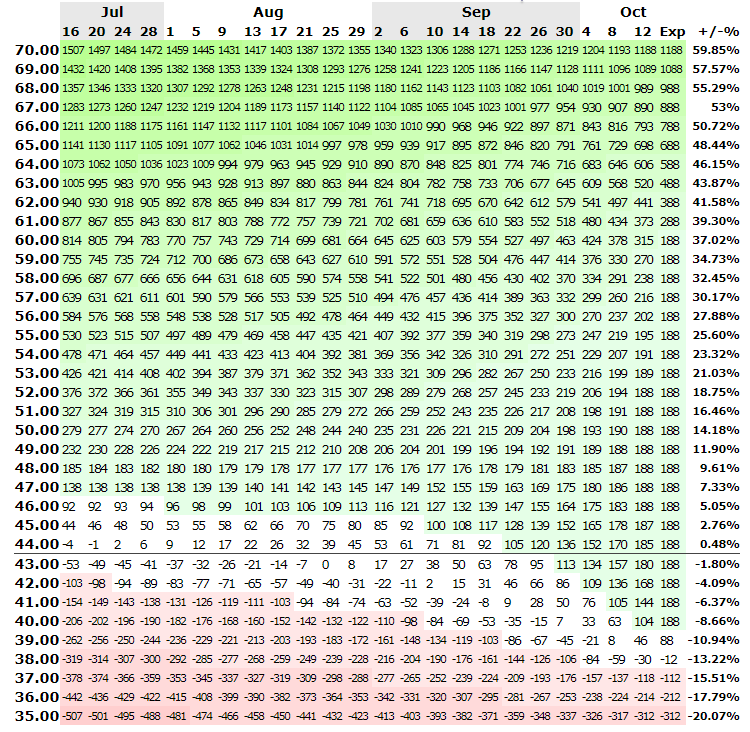
You can reference optionsprofitcalculator.com/calculation/dk… to follow along (click the calculate button). The numbers in the attached table represent approximate profit/loss in dollars relative to the date. Again, we've been using 1 contract for simplicity's sake.
Yes, this is extremely bullish. 35,000 contracts both ways is no joke. But this doesn't mean "I should buy 10/15 60c because this trader is that bullish". Remember this trader basically got those for free.
• • •
Missing some Tweet in this thread? You can try to
force a refresh
The Flow menu has a slightly new look. I'd like to briefly touch on what you can expect to see in each section.
Flow: (1) The options flow feed (2) You can see the full range of transactions from any one date of your choosing, as well as filter in/out other variables (3) View the flow charts (4) View the breakdown by expiration and strike charts
Dark flow: (1) The dark pool transaction feed (2) You can hover over the sold/trade codes for more information (3) View the dark pool breakdown charts
I know it seems like there is a lot happening on the @unusual_whales website, so I will try to highlight some of the sections that may not get as much attention as others.
You can configure your notification settings anyway you like. Here are some examples. To receive push notifications you will need to download the mobile application (Unusual Whales). unusualwhales.com/settings/notif…
I took the last 10 lines from today's TSLA order flow and will recreate the pie charts based on the info we see. Hopefully it will help you understand how the information in the pie charts is calculated!
When you're on the flow and you click "Show Charts" you'll see 5 pie charts running across the bottom.
From left to right they are: 1. # Calls v Puts 2. Volume Calls v Puts 3. Premium Calls v Puts 4. Ask v Bid side 5. Bear/Bull flow
1. If we look through our 10 lines of Tesla data, we will see there are literally 5 calls and 5 puts. So our first chart will be 50/50 calls/puts.
2. Adding up call and put volume gives us 103 for calls (50+50+1+1+1) and 6 for puts (1+1+2+1+1).