[Thread]
The population of South Africa was estimated to be 60,14 million at mid-year 2021, an increase of about 604 281 (1,01%) since mid-year 2020.
Read more here: bit.ly/3zgZtin
#StatsSA #SApopulation
The population of South Africa was estimated to be 60,14 million at mid-year 2021, an increase of about 604 281 (1,01%) since mid-year 2020.
Read more here: bit.ly/3zgZtin
#StatsSA #SApopulation

#COVID19 impacted on the three major drivers of population movements.
Read more here: bit.ly/3zgZtin
#StatsSA #SApopulation
Read more here: bit.ly/3zgZtin
#StatsSA #SApopulation

Births are the main driver of population growth in South Africa. Compared to previous years, deaths in 2021 are significantly higher as a result of the #COVID19 outbreak.
Read more here: bit.ly/3zgZtin
#StatsSA #SApopulation
Read more here: bit.ly/3zgZtin
#StatsSA #SApopulation

More than half of the population live in 3 provinces (GP, KZN and WC). GP remains SA’s most populated province with approximately 15,8 million people living in this province.
Read more here: bit.ly/3zgZtin
#StatsSA #SApopulation
Read more here: bit.ly/3zgZtin
#StatsSA #SApopulation

GP has increased its share of the total population by 5,4% points between 2002 and 2021. EC saw the largest drop in its proportion of the total population from 14% in 2002 to 11% in 2021.
Read more here: bit.ly/3zgZtin
#StatsSA #SApopulation
Read more here: bit.ly/3zgZtin
#StatsSA #SApopulation

Children and youth amount to nearly 38 million in SA. South Africa is a demographically youthful population with a median age of 28.
Read more here: bit.ly/3zgZtin
#StatsSA #SApopulation
Read more here: bit.ly/3zgZtin
#StatsSA #SApopulation

Approximately 51,1% (30,8 million) of the population is female.
Read more here: bit.ly/3zgZtin
#StatsSA #SApopulation
Read more here: bit.ly/3zgZtin
#StatsSA #SApopulation

The black African population constitutes approximately 81% of the total #SApopulation.
Read more here: bit.ly/3zgZtin
#StatsSA
Read more here: bit.ly/3zgZtin
#StatsSA

The population pyramid reflects a youthful population. While #COVID19 has had a devastating social & economic impact, the change in population structure is minimal. However, the indicators of mortality, not reflected here, are impacted.
Read more here: bit.ly/3zgZtin
Read more here: bit.ly/3zgZtin

The population profile differs significantly by province. GP has a higher proportion of adults aged 25-39 when compared to EC, which has a higher proportion of children aged 0-14 and elderly.
Read more here: bit.ly/3zgZtin
#StatsSA #SApopulation
Read more here: bit.ly/3zgZtin
#StatsSA #SApopulation

From ages 40 and older, women make up a greater proportion of the age group.
Read more here: bit.ly/3zgZtin
#StatsSA #SApopulation
Read more here: bit.ly/3zgZtin
#StatsSA #SApopulation

Child dependency is on the decline as the #fertility rate declines and life expectancy rises. Old-age dependency increased when compared to 2002 due to increase in life expectancy post-2006.
Read more here: bit.ly/3zgZtin
#StatsSA #SApopulation
Read more here: bit.ly/3zgZtin
#StatsSA #SApopulation

LP has the highest proportion of children under 15 whilst Gauteng has the highest proportion of youth and adults (15-59).
Read more here: bit.ly/3zgZtin
#StatsSA #SApopulation
Read more here: bit.ly/3zgZtin
#StatsSA #SApopulation

On average, a woman will give birth to 2,31 children in her lifetime.
Read more here: bit.ly/3zgZtin
#StatsSA #SApopulation #fertility
Read more here: bit.ly/3zgZtin
#StatsSA #SApopulation #fertility

Demographic drivers of #fertility, mortality and #migration over time determines provincial population age and sex profiles. Less urbanised provinces of LP and EC indicate higher fertility rate.
Read more here: bit.ly/3zgZtin
#StatsSA #SApopulation
Read more here: bit.ly/3zgZtin
#StatsSA #SApopulation

Births are the main driver of population growth in South Africa.
Read more here: bit.ly/3zgZtin
#StatsSA #SApopulation
Read more here: bit.ly/3zgZtin
#StatsSA #SApopulation

The NW has shown larger drops in #fertility relative to other provinces.
Read more here: bit.ly/3zgZtin
#StatsSA #SApopulation
Read more here: bit.ly/3zgZtin
#StatsSA #SApopulation

There was a significant rise in the number of deaths in 2021, approximately 34%.
Read more here: bit.ly/3zgZtin
#StatsSA #SApopulation
Read more here: bit.ly/3zgZtin
#StatsSA #SApopulation

Total Life Expectancy (LE) at birth declined from 65,5 to 62 years. Decline in Life expectancy is due to the rise in excessive deaths during #COVID19 pandemic.
Read more here: bit.ly/3zgZtin
#StatsSA #SApopulation
Read more here: bit.ly/3zgZtin
#StatsSA #SApopulation

Free State has a significantly lower life expectancy (LE) than the SA average.
Read more here: bit.ly/3zgZtin
#StatsSA #SApopulation
Read more here: bit.ly/3zgZtin
#StatsSA #SApopulation

Infant mortality rate has declined over time to 24.1 in 2021. The child-sparing pattern of #COVID19 has had no significant impact on child mortality levels in the country thus far.
Read more here: bit.ly/3zgZtin
#StatsSA #SApopulation
Read more here: bit.ly/3zgZtin
#StatsSA #SApopulation

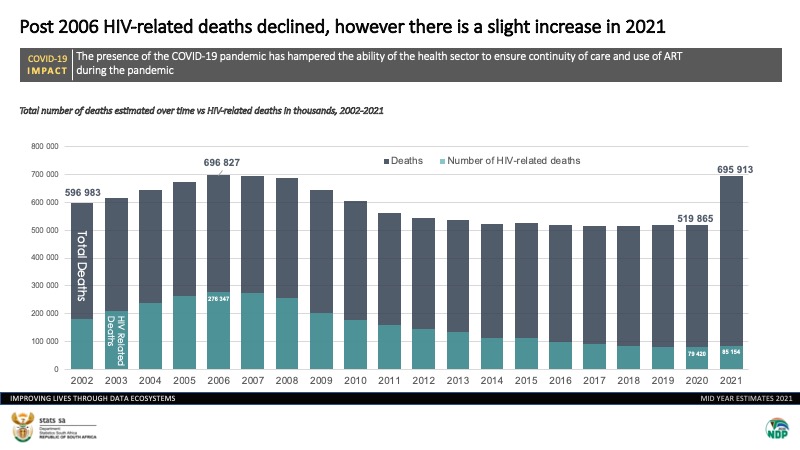
8,23 million people are living with HIV in 2021. The presence of a competing pandemic such as #COVID19 in South Africa presents challenges likely to hamper progress in the eradication of HIV and AIDS.
Read more here: bit.ly/3zgZtin
#StatsSA #SApopulation
Read more here: bit.ly/3zgZtin
#StatsSA #SApopulation

Post-2006, HIV-related deaths declined; however, there is a slight increase in 2021.
Read more here: bit.ly/3zgZtin
#StatsSA #SApopulation
Read more here: bit.ly/3zgZtin
#StatsSA #SApopulation

The period 2016-2021 saw a reversal of the earlier growth in net international #migration.
Read more here: bit.ly/3zgZtin
#StatsSA #SApopulation
Read more here: bit.ly/3zgZtin
#StatsSA #SApopulation

For the period 2016 -2021, net #migration is expected to be 852 992.
Read more here: bit.ly/3zgZtin
#StatsSA #SApopulation
Read more here: bit.ly/3zgZtin
#StatsSA #SApopulation

Over the period 2016 to 2021 five provinces had net inflows of people. GP attracted the most migrants.
Read more here: bit.ly/3zgZtin
#StatsSA #SApopulation #migration
Read more here: bit.ly/3zgZtin
#StatsSA #SApopulation #migration

GP is estimated to experience the largest net inflow of migrants of approx. 991 590 net migrants.
Read more here: bit.ly/3zgZtin
#StatsSA #SApopulation #migration
Read more here: bit.ly/3zgZtin
#StatsSA #SApopulation #migration

WC is estimated to experience the second highest net inflow of migrants for the period 2016 to 2021 of approx. 470 657.
Read more here: bit.ly/3zgZtin
#StatsSA #SApopulation #migration
Read more here: bit.ly/3zgZtin
#StatsSA #SApopulation #migration

• • •
Missing some Tweet in this thread? You can try to
force a refresh


