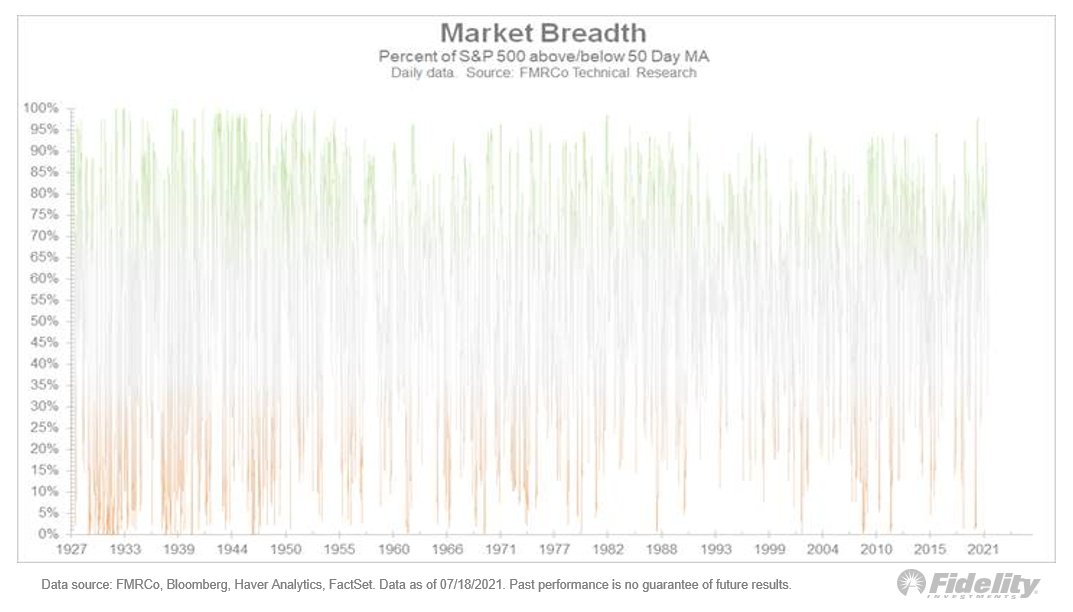
Unusual: The S&P 500 index is at an all-time high while fewer than 50% of its constituents are above their 50-day moving average. In fact, by my calculation, the recent signal is only the third one since 1927… (THREAD)
The first one was June 24, 1998, just before the LTCM fund top (for those who recall it) and the second one was December 21,1999, just before the dotcom bubble peak. The first preceded a 20% drawdown & the second preceded a 53% decline. /2
The third and most recent occurred just a few weeks ago. /3
I’m not calling for a major drawdown but the narrowness of the current advance does fit with the narrative that the market is in a holding pattern as it transitions from early-cycle to mid-cycle while, at the same time, the Fed is trying (again) to take away the punchbowl. /END

• • •

Missing some Tweet in this thread? You can try to force a refresh
 

Keep Current with Jurrien Timmer

Jurrien Timmer Profile picture

Stay in touch and get notified when new unrolls are available from this author!

Read all threads

This Thread may be Removed Anytime!

PDF

Twitter may remove this content at anytime! Save it as PDF for later use!

Try unrolling a thread yourself!

how to unroll video
  1. Follow @ThreadReaderApp to mention us!

  2. From a Twitter thread mention us with a keyword "unroll"
@threadreaderapp unroll

Practice here first or read more on our help page!

More from @TimmerFidelity

16 Jul
Is the market a bubble ready to burst? In recent threads, I examined that question from a variety of angles, using a discounted cash flow (DCF) model, which helps us quantify the effects of today’s ultra-low interest rates and abundant financial engineering. A summary: (THREAD)
Without even getting into the equity risk premium and payout ratio, it's fair to say that today’s low rates have added 5 P/E points to the market’s valuation, and the many trillions in buybacks since 2004 has added another 5 points. /2
That’s 10 P/E points of additional valuation. Absent these factors, the S&P 500 would trade at a 15x trailing P/E instead of 25x. Coincidently, 15x was the average P/E ratio for the market’s entire history prior to the current era. /3
Read 10 tweets
15 Jul
Is the market a bubble ready to burst? In this thread, we'll consider what share buybacks have to say about it: (THREAD)
With dividends being relatively stable and the DCF placing a lot of weight on the terminal value (long-term growth after 5 years), the main variable to consider is the pace of share buybacks, which affect the payout ratio. /2
Historically, earnings growth has been 6% in the US, and in recent years the payout ratio has been around 90%. Currently (a/o Q1) it’s 71%, with dividends comprising 35% and buybacks 36%. /3
Read 21 tweets
14 Jul
Is the market a bubble ready to burst? An important factor to consider is the risk-free rate (RFR), aka the 10-year Treasury yield. So let's dive in: (THREAD)
It doesn't take a leap of faith to see that monetary policy is suppressing interest rates. This chart shows it. Nominal yields on the vertical axis and TIPS break-evens on the horizontal. The size of the bubbles (no pun intended) shows the size of the Fed’s balance sheet. /2
Based on the regression between these two variables, the current level of the 10-year is about 100 bps lower than it “should” be. This chart shows the 10-year vs the above TIPS model. Are today’s subdued yields the result of policy? It seems that way to me. /3
Read 10 tweets
13 Jul
Following up on the previous thread, as we seek to answer the question: “Is the market a bubble that is ready to burst?” The next factor to look at is the equity risk premium. (THREAD)
The discount rate (or cost of capital) consists of the risk-free rate (10 year Treasury yield) plus the equity risk premium. The ERP is like a credit spread, reflecting the additional return investors demand as compensation for additional volatility vs. the risk-free asset. /2
The surge in “excess money” (money supply growth less GDP growth) resulting from the fiscal/monetary response to the pandemic has clearly elevated the market’s valuation, as the chart below shows. /3
Read 13 tweets
13 Jul
With stocks trading at near-record valuations and the Fed hoping to retreat from the zero lower bound (ZLB) and its $120 billion in monthly asset purchases, everyone wants to know: Is this market a bubble that is about to burst? Let's take a hard look. (THREAD)
I’m going to try the process of looking at all the market’s moving parts through the lens of the discounted cash flow model (DCF). It’s a good exercise in discipline in that it forces me to actually quantify the puzzle pieces.
For the DCF there are four important variables that we need to consider: earnings growth, the payout ratio (dividends + buybacks as a percent of earnings), interest rates, and the equity risk premium. /2
Read 9 tweets
12 Jul
Sentiment. It finds its way into a lower ERP, as it did at the secular peak in 2000, but we can also measure it through investor behavior. (THREAD)
We know about speculation in meme stocks & non-profitable tech this cycle. Margin debt has growth dramatically on a year-over-year basis, although as a percentage of market cap, margin debt remains well below the peak in the 2000s. /2
With retail speculation presumably limited to a relatively small subset of the market, looking at long-term flows--that is, regular investors saving for retirement--we see very little evidence of exuberance. /3
Read 5 tweets

Did Thread Reader help you today?

Support us! We are indie developers!


This site is made by just two indie developers on a laptop doing marketing, support and development! Read more about the story.

Become a Premium Member ($3/month or $30/year) and get exclusive features!

Become Premium

Too expensive? Make a small donation by buying us coffee ($5) or help with server cost ($10)

Donate via Paypal Become our Patreon

Thank you for your support!

Follow Us on Twitter!

:(