Texas C19 Fatality reporting RE: Delta Variant.

1/n

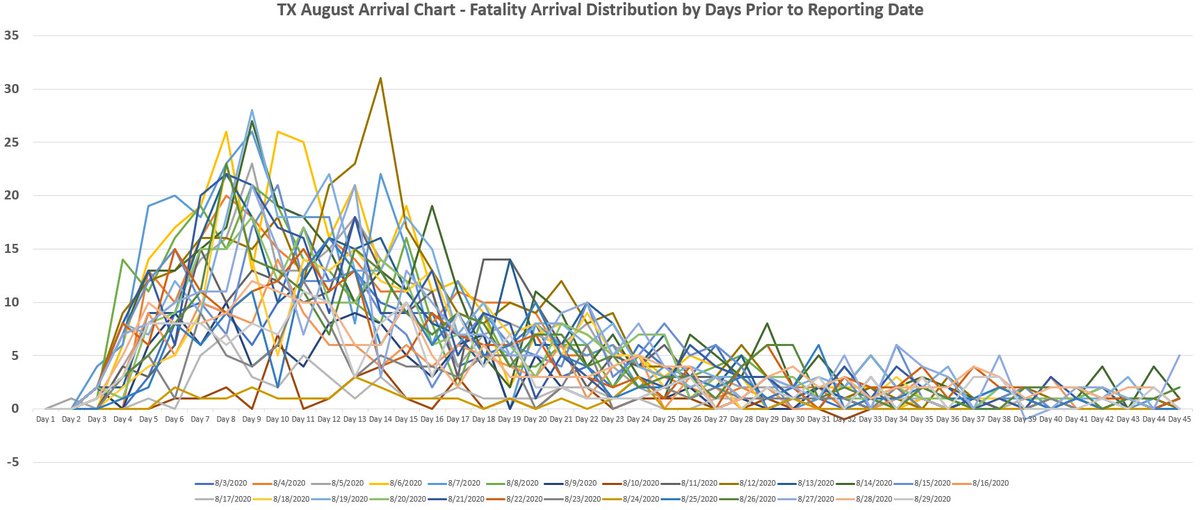
This will be a thread, no way to put it in 1 tweet. Fatalities are reported by Date of Death. Death Certificates arrive to the State over time. This arrival can be charted, below is charting from Aug 20.

1/n Stay with me
Every day, the state reports the number of fatalities, but each day's report is comprised of anywhere between 1 & 60 days worth of fatalities. Each Death Cert takes a different amount of time to process.

Again from August, the report for 8/23. This goes on every single day.

2/n
Going back to the Aug 20 arrival charts, I charted every day's report. Basically if a day is X number of days in the past, Y% of the deaths have come in for it.

Today minus 14 days - 57% of the fatalities have been reported for that date.
- 21 Days - 79%
- 28 Days - 90%

3/n
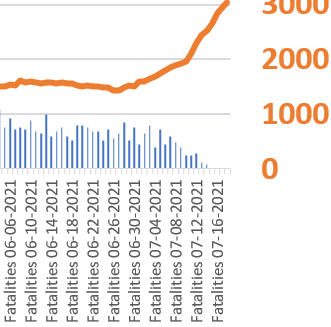
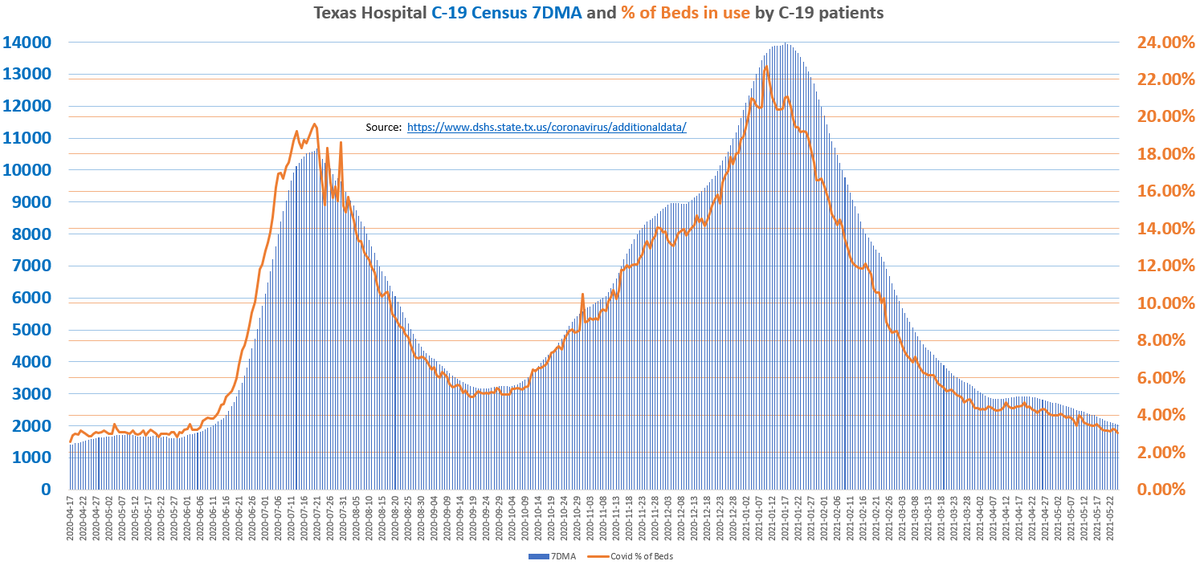
So bring that to the fatality reporting for the Delta Variant. Here is the fatality reporting for yesterday, overlaid with hospitalizations. They've always tracked closely. But look at the last 3-4 weeks, its diverging! Well, no. Its not. At least not yet.

4/n
I can use my arrival chart from August to project what days 7-28 will look like. Side by side, here is the chart in 4/n zoomed in for the past few weeks, next to me projecting what it likely will actually end up being using the arrival percentages

5/n
All to say that based on a limited sample of Aug 2020, I project we will start seeing a slight increase in fatalities following the hospitalization curve. This is not necessarily a function of lethality of Delta. Its more a function of processing of death certificates.

6/n
If the processing has gotten more efficient, then perhaps we don't see this projected increase.

But in summary: We haven't had a day above 25 fatalities since June 2. Lowest since this all started. Its likely going to climb some from here.

Facts and Data over fear.

7/end
8/PS

I'm recording my projections so I'll be able to see over time how good they were. I've been doing this long enough, I'll end up being close.

I do see in the charting that fatalities are clearly lower in relation to hospitalizations than they were in 2020.

• • •

Missing some Tweet in this thread? You can try to force a refresh
 

Keep Current with therealarod1984

therealarod1984 Profile picture

Stay in touch and get notified when new unrolls are available from this author!

Read all threads

This Thread may be Removed Anytime!

PDF

Twitter may remove this content at anytime! Save it as PDF for later use!

Try unrolling a thread yourself!

how to unroll video
  1. Follow @ThreadReaderApp to mention us!

  2. From a Twitter thread mention us with a keyword "unroll"
@threadreaderapp unroll

Practice here first or read more on our help page!

More from @therealarod1984

21 Jul
US virologist Ralph Baric, author of the 2013 paper “A SARS-like cluster of circulating bat coronaviruses shows potential for human emergence,” says Wuhan Dr. Shi's Coronavirus work in a less safe security level of BSL-2 is “an actual scandal”

1/n

technologyreview.com/2021/06/29/102…
"NIH decided the risk was worth it. In a...fateful decision, it funded work similar to Baric’s at the Wuhan Institute of Virology.

Unnoticed by most...was a key difference...the Chinese work was carried out at biosafety level 2 (BSL-2), much lower than Baric’s BSL-3+

2/n
"what occurred is a scenario Fauci himself had outlined in a 2012 commentary...Fauci wrote “Scenario [where] an important gain-of-function experiment involving a virus with serious pandemic potential...leads to an outbreak and ultimately triggers a pandemic?”"

#Sick

3/n
Read 9 tweets
16 Jul
.
U.S Centers for Disease Control (CDC) - July 2021 publication of "Preventing Chronic Disease" says:

** Only 3.5% of Covid-19 deaths occurred in people with 1 or fewer comorbidity

* 96.5% had 2 or more
* 64.2% had 6 or more

H/T @andrewbostom

1/n

cdc.gov/pcd/issues/202…
Top comorbidities listed in the July 2021 CDC publication:

1) High Blood Pressure
2) Lipid Metabolism Disorders
3) Obesity
4) Diabetes with complications
5) Heart disease
6) Esophageal disorders
7) Kidney disease
8) Anxiety disorder
9) COPD
10) Thyroid disorder

2/n
Of course, we've known this for a year.

Covid-19 is a disease that strikes the old and the infirm.
80% of the deaths over age 65, a median age of 80, and 96.5% of the deaths occur in people with multiple comorbidities. 65% had 6 or more!!!

3/n

Read 5 tweets
2 Jul
Ugh. Me Neanderthal. Me return from long Mastodon hunt over at lease.

Today is 4 full moon since Tribe Chief Abbott say no more paper on face. We have feast today to celebrate, do many cave drawings, make thread on Little Blue Bird, to celebrate! Grunting out Loud!

1/n
Me remember that day 4 full moon ago, when Scared little Sleepy Chief Biden @JoeBiden, Witch Doctor Fauci @_NIADA, other scared Cro-Magnons say we have Neanderthal thinking, more Covid come for Neanderthal.

GOL! Look at Cave Drawing for sick Neanderthal! It go down, no up!

2/n
@JoeBiden @_NIADA And scared baby Cro-Magnons like @BetoORourke and @JudgeClayJ @GavinNewsom say death warrant, unfortunate, that more Neaderthal will go to sick cave. ROTDL, they so wrong, how can anyone listen to them? Their seer no work! Look at Sick Cave drawing, also go down, no up!

3/n
Read 5 tweets
3 Jun
Team Reason had Fauci pegged for a year or more.

When I review my Covid Twitter life, theres so many examples of calling out his duplicity, his hypocrisy. Outright lies. Some really funny ones that got some visibility LOL!

Lets go down memory lane, cuz why not

1/
This one re: Rand vs Fauci on natural immunity got a ton of visibility

2/n
This one was fun. I think Ben Shapiro RTD it. Good ole Zodiac Fauci. A position for every month

3/n
Read 7 tweets
2 Jun
.
Watching for a Texas Border Covid-19 Sequel

Last Summer, the Covid surge in the Southern states, particularly Texas, was driven by Seasonality - specifically seasonality in the Southern areas of the Hemisphere. In Texas' case - the far south counties and Mexico.

1/ THREAD
The Border Counties along the Rio Grande comprise 9% of the total Texas population. During the Summer 2020 Wave, those counties were accounting for fatalities over 2.5X their population, nearly 25% of the entire state.

2/
Below shows the impact of the border counties to the Summer Wave as opposed to Winter 2020/2021 Wave.

Again, 9% of the population driving 25% of that first big wave. The second wave, not so much. Hench why previous chart shows Border is now just 18% of total fatalities.

3/
Read 8 tweets
27 May
Texas - What's next?

As we shift to post-pandemia, we won't forget what we've learned. Last June, we saw a Mexico driven wave in the South Texas, so despite likely hitting HIT already, we will watch

Meanwhile, hosps down 86.2% since 1/11 peak & 55.5% since end of Mandates

1/
I'll keep an eye on these hosps numbers going forward but won't be posting as much about them. We are nearing Pandemic lows across the board.

Especially ICUs. Raw numbers competing with April 2020 when hospitals were virtually closed.

This thing is over, now what?

2/
In the coming days I will update the below reporting. Best thing I have in my arsenal for "seasonality" is to watch the #s coming out of the border counties.

Because what has Mexico's vaccine rollout looked like? What's their HIT? I don't know.

3/end

Read 4 tweets

Did Thread Reader help you today?

Support us! We are indie developers!


This site is made by just two indie developers on a laptop doing marketing, support and development! Read more about the story.

Become a Premium Member ($3/month or $30/year) and get exclusive features!

Become Premium

Too expensive? Make a small donation by buying us coffee ($5) or help with server cost ($10)

Donate via Paypal Become our Patreon

Thank you for your support!

Follow Us on Twitter!

:(