Pandas
- Pandas is probably one of the most powerful and flexible open source data analysis and manipulation tool available in any language.
- It provides a wide range of functions for data wrangling and cleaning.
resources:
1⃣ youtube.com/playlist?list=…
2⃣
- Pandas is probably one of the most powerful and flexible open source data analysis and manipulation tool available in any language.
- It provides a wide range of functions for data wrangling and cleaning.
resources:
1⃣ youtube.com/playlist?list=…
2⃣
NumPy (Numerical Python)
- NumPy is an open source project aiming to enable numerical computing with Python.
- It provides functions and methods for performing high level mathematical functions on multi-dimensional arrays and matrices.
resources:
1⃣
- NumPy is an open source project aiming to enable numerical computing with Python.
- It provides functions and methods for performing high level mathematical functions on multi-dimensional arrays and matrices.
resources:
1⃣

Matplotlib (Data Visualization)
- Matplotlib is a comprehensive library for creating static, animated, and interactive visualizations in Python.
resources:
1⃣
2⃣ github.com/ammaryh92/Data… (matplotlib + seaborn)
- Matplotlib is a comprehensive library for creating static, animated, and interactive visualizations in Python.
resources:
1⃣
2⃣ github.com/ammaryh92/Data… (matplotlib + seaborn)

Seaborn (Data Visualization)
- Seaborn is a Python data visualization library based on Matplotlib. It provides a high-level interface for drawing attractive and informative statistical graphics.
resources:
The previous Github repository.
- Seaborn is a Python data visualization library based on Matplotlib. It provides a high-level interface for drawing attractive and informative statistical graphics.
resources:
The previous Github repository.

Scikit-Learn
- Scikit-Learn is an open source machine learning library.
- It is built upon SciPy, and it provides a wide range of machine learning algorithms such as regression, classification, clustering, etc.
resources:
1⃣
2⃣
- Scikit-Learn is an open source machine learning library.
- It is built upon SciPy, and it provides a wide range of machine learning algorithms such as regression, classification, clustering, etc.
resources:
1⃣
2⃣

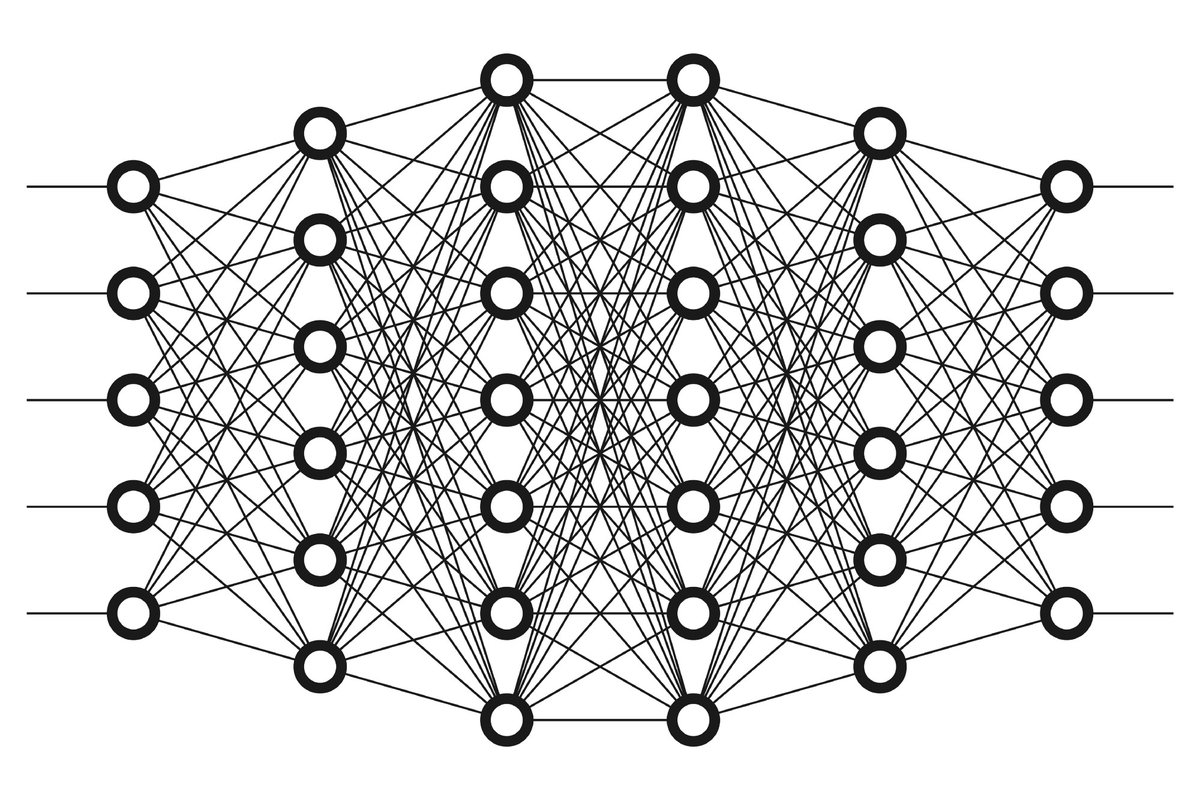
TensorFlow
- An open source end-to-end machine learning library that allows you to develop and train models.
- TensorFlow focuses mainly on training and inference of deep neural networks.
resources:
1⃣
(part 1)
(part 2)
👇👇
- An open source end-to-end machine learning library that allows you to develop and train models.
- TensorFlow focuses mainly on training and inference of deep neural networks.
resources:
1⃣
(part 1)
(part 2)
👇👇

2⃣
OpenCV
- An open source computer vision and machine learning library.
- It has a huge number of algorithms for computer vision applications such as object detection, face recognition, movement tracking, etc.
resources:
1⃣
👇👇
- An open source computer vision and machine learning library.
- It has a huge number of algorithms for computer vision applications such as object detection, face recognition, movement tracking, etc.
resources:
1⃣
👇👇

Subscribe to this youtube channel for really cool computer vision applications.
youtube.com/channel/UCYUjY…
youtube.com/channel/UCYUjY…
Other libraries include:
SciPy
PyTorch (Similar to TensorFlow)
statsmodel
plotly (for creating dashboards)
XGBoost
SciPy
PyTorch (Similar to TensorFlow)
statsmodel
plotly (for creating dashboards)
XGBoost
That's it for this thread.
If you find it useful, kindly consider retweeting the first tweet.
For more #DataScience and #MachineLearning content, follow me @ammaryh92.
If you find it useful, kindly consider retweeting the first tweet.
For more #DataScience and #MachineLearning content, follow me @ammaryh92.
• • •
Missing some Tweet in this thread? You can try to
force a refresh