$65,000 is not top end of #Bitcoin cycle, bull market is not over!
I recently did an article using MVRV to map the cycles and behavior during bear and bull market period
In this text you will see a new cycle mapping, but using another data, this time the Puell Mutiple
Thread👇
I recently did an article using MVRV to map the cycles and behavior during bear and bull market period
In this text you will see a new cycle mapping, but using another data, this time the Puell Mutiple
Thread👇

1. The mapped sequence tells the timing during Bitcoin's bull and bear market. The cycles are standardized and the movements are similar.
In all cycles there were tops in the middle of the bull market in which led the Puell Multiple towards the green box (bottom|buy region) 👇
In all cycles there were tops in the middle of the bull market in which led the Puell Multiple towards the green box (bottom|buy region) 👇
signaling the best buying moment during the bull market, the MVRV indicator also indicated this moment.
2. The red box marked ALL of #Bitcoin 's END-CYCLE TOPS, and see how the $65,000 top arrived only in the yellow box, which also signals tops, but not end-of-cycle tops.
2. The red box marked ALL of #Bitcoin 's END-CYCLE TOPS, and see how the $65,000 top arrived only in the yellow box, which also signals tops, but not end-of-cycle tops.

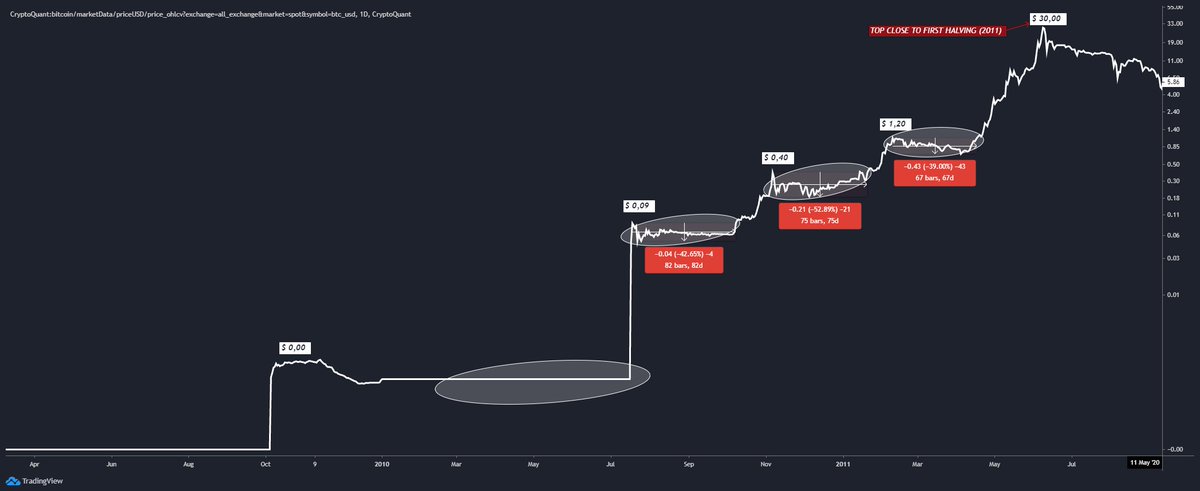
In the sequence outlined (1) is the buying moment during the bull market, and in the first cycle of 2011 during 3 corrections between -40% to -55% deep we can see this same opportunity. The indicator hit higher than in the yellow and red box because of the high volatility 👇
as the marketcap of the asset was very low at the time.
3. In 2011, the mid-cycle tops were above the red region, as well as in 2013 too. Already in 2017 we can see something similar to the current bull run, in which the mid-cycle top was held in the yellow box.
3. In 2011, the mid-cycle tops were above the red region, as well as in 2013 too. Already in 2017 we can see something similar to the current bull run, in which the mid-cycle top was held in the yellow box.

In #Bitcoin 's second cycle, after leaving a top in the $240 region prices correct about 75% in the middle of the bull market, also leaving exactly the same behavior in the indicator, signaling the best buying moment during the bull market. 

4. Only after searching the green box for at least once during the bullish market does the Puell Multiple potentially search the red box again to then mark the top end of that cycle.
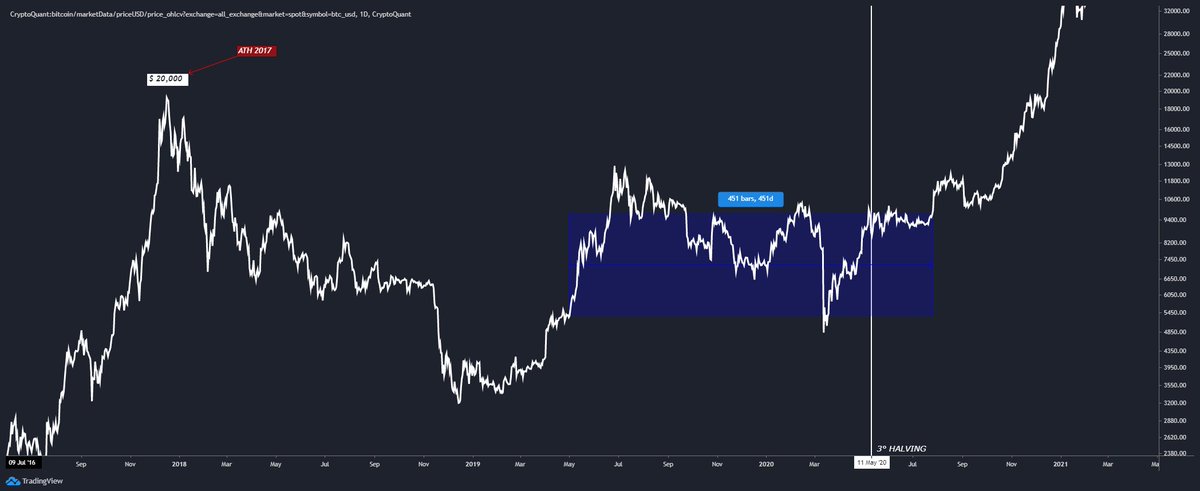
5. In the previous cycle, 2017, there were 3 corrections marking 3 buying opportunities in the middle of Bitcoin's bull run. The indicator arrived only in the yellow box, as in the current cycle.
The corrections giving opportunity in this cycle were between -30% to 40% deep, 👇
The corrections giving opportunity in this cycle were between -30% to 40% deep, 👇

with much lower volatility compared to the past 2 cycles.
6. Only after touching the red region does the price find a top to end the cycle and then the next time the Puell Multiple goes to the green box it marks the beginning of the bear market.
6. Only after touching the red region does the price find a top to end the cycle and then the next time the Puell Multiple goes to the green box it marks the beginning of the bear market.

Delineated in sequence (2), the first time the green region is reached the bear market begins and soon after prices will find lower bottoms in the trend, giving the best time to buy during the bear market when the Puell Multiple goes below the green region. 

7. The moment when the indicator stays below the green box is seen as a brief opportunity, and in all cycles we don't stay for long in that range.
Notice how this moment we can also observe in the MVRV that I did the mapping recently, the same buying moment and end-of-cycle 👇
Notice how this moment we can also observe in the MVRV that I did the mapping recently, the same buying moment and end-of-cycle 👇
top hits in both indicators.
8. In the first cycle, 2011 there were 3 corrections in the middle of the bullish market marking 3 tops before the All Time High end of cycle, already in 2013 there was only 1 top in the middle of the cycle leaving the indicator leveled in the 👇
8. In the first cycle, 2011 there were 3 corrections in the middle of the bullish market marking 3 tops before the All Time High end of cycle, already in 2013 there was only 1 top in the middle of the cycle leaving the indicator leveled in the 👇

same range a little above the red region.
In the previous cycle, 2017 there were also 3 corrections in the middle of the bull market, however the difference is the Puell Multiple not seeking the red box during these corrective tops, much like the current cycle in which 👇
In the previous cycle, 2017 there were also 3 corrections in the middle of the bull market, however the difference is the Puell Multiple not seeking the red box during these corrective tops, much like the current cycle in which 👇
also $65,000 stopped in the yellow box.
9. What is interesting to note in 2017 is the period of larger accumulations than previous cycles, with the first cycle being much faster than all the others. This signaling shows the distribution of the asset among more participants 👇
9. What is interesting to note in 2017 is the period of larger accumulations than previous cycles, with the first cycle being much faster than all the others. This signaling shows the distribution of the asset among more participants 👇

during the evolution of the market.
The current momentum over 70 days accumulating at the bottom in the middle of the bull run says a lot about this.
The current momentum over 70 days accumulating at the bottom in the middle of the bull run says a lot about this.
10. After delivering the best buying opportunity during the bear market, prices go for it between the top of the green box and the yellow region, delivering the sigh in the middle of the bear market. 

Outlined in the sequence (4) is the moment that the Halving event happens and signals the end of the bear market, starting the next new bullish cycle, notice how in all cycles the event happens notice how in all cycles the event happens during this sequence and does not lose 👇
the bottom realized in sequence (3).
11. This moment during the Halving event is the second best buying moment during the bear market, notice that the Puell Multiple seeks again the bottom of the green box in all cycles after the breather.
11. This moment during the Halving event is the second best buying moment during the bear market, notice that the Puell Multiple seeks again the bottom of the green box in all cycles after the breather.

This moment marks the end of the bear market and the beginning of the new valuation cycle that happens only after the Halving, it is like the "start for the race". 

12. This happens simply because of the supply shock that is caused because of the aforementioned event.
The demand for #Bitcoin is rising, as its demand is set and issuance adjusted on average every 4 years (210,000 blocks).
The demand for #Bitcoin is rising, as its demand is set and issuance adjusted on average every 4 years (210,000 blocks).
The sequence marks this point being the last for the start of the new bullish cycle.
(1) Middle of the bull market
(2) End of bull market, beginning of bear market
(3) Mid bear market
(4) End of bear market, Start of bull market
(1) Middle of the bull market
(2) End of bull market, beginning of bear market
(3) Mid bear market
(4) End of bear market, Start of bull market
To identify the current moment clearly taking the historical pattern of previous cycles into consideration, see below the projection of the Puell Multiple and its movement from here: 

These are two different metrics (MVRV and Puell Multiple) coming to the same conclusion. The current moment is halfway through the bull run, historically speaking, and the last All Time High in the $65,000 range is not an end-of-cycle top, we are still going higher.
Having identified the current momentum of the cycle we can project a target from the last ATH to look at possible ranges where this cycle should end. 

🔴In the first cycle, 2011, I took only the last leg up to the top that marked end of that cycle. The projection goes up to the $1,759,717.09 ($1 million, seven hundred thousand) range. 

🔴In 2013, after the only top in the middle of that bull market we can project up to the top that signals the end of that cycle and we take prices up to the $307,920.75 region for the current bull run. 

🔴In the last cycle we can project two legs as the volatility in terms of the mid-cycle tops was lower compared to the cycles before this one. The first projection takes us to $163,236.39 and the second projection to $249,067.25 

🟢I strongly believe in this cycle Bitcoin will reach between these 2 projected 2017 targets, which averaged between -35% -40% retracement, but see that the 2013 target is very close and the current bull run resembles the 2013 target.
🟢The volatility in the first two cycles was much higher compared to 2017 and currently, however we cannot rule out a "super cycle" with high volatility and explosion in valuation, in terms of percentage, hence the projections showing only the last leg which corresponds 👇
to the current momentum in the 2011 and 2013 cycles.
-What do my friends think of this projection?
@DanielJoe916 @CryptoVizArt @crypto_div @tempting_beef @crypto_birb @mason_jang @JanWues
-What do my friends think of this projection?
@DanielJoe916 @CryptoVizArt @crypto_div @tempting_beef @crypto_birb @mason_jang @JanWues

• • •
Missing some Tweet in this thread? You can try to
force a refresh


