Three of today’s five newly reported #COVID19 deaths date from February, raising some skeptics’ red flags.

Unfortunately we only have a month or so of data to examine this, but what I see doesn’t raise MY red flags. 1/
2/ First: we know in general that many death certificates are filed promptly, but others can take many weeks or months to file. The data has what’s called a “long tail” — it’s not super weird for there to be OCCASIONAL months-old death certificates filed.
3/ In general, when working with death data, it’s often best to exclude the most recent 3-4 weeks of data *at a minumum*.

For example, here’s CDC death data. You can see the 2021 line plunge at the end, but that’s not a real decline. It’s just data slowly trickling in. Image
4/ This is, of course, not very useful for those of us trying to figure out what’s happening NOW. So we resort to various expediencies, like using data by *report date* instead of death date.

This has many problems; we just sort of hope the problems smooth out over time?
5/ Like, the newly reported COVID deaths are going to include some old deaths. But if the share of old deaths holds roughly constant over time, this isn’t a *huge* problem. If 20% of this week’s deaths are 3+ months old, but back in April 20% were ALSO 3+ months old, no biggie?
6/ I check this regularly by comparing the curves of #COVID19 deaths by death date vs. by report date. As you can see, while there are some differences due to lags, the shapes are very similar. That’s a good sign. Image
7/ But to get beyond the gut-check level, we need more granular data.

The good news is we have that.

The bad news is we only started getting it a month ago. That’s not really enough time to speak conclusively about patterns.
8/ That granular data is (near-)daily updates in the number of COVID deaths by death date. If one were to record this data every day (as I do) you can look at the changes — how old were each day’s deaths? — and plot that over time.
9/ Over the month of data we have, you can see that (this past incomplete week excluded) well over 50% of reported deaths occurred within the past 7 days.

An average of maybe 20% (up and down) have been really old. And then a smattering in between. Image
10/ Again: this is like a month of data. It’s not enough to speak conclusively about any trends. But in context with other things we know, it doesn’t suggest there’s a major problem with really old death data — sometimes you get data dumps, but they’re not the norm.
11/11 Looking forward to checking back in on this later this fall, when we have more robust data. (And this is why @mnhealth should have started reporting this data last year, when I and other reporters asked…)

• • •

Missing some Tweet in this thread? You can try to force a refresh
 

Keep Current with David H. Montgomery

David H. Montgomery Profile picture

Stay in touch and get notified when new unrolls are available from this author!

Read all threads

This Thread may be Removed Anytime!

PDF

Twitter may remove this content at anytime! Save it as PDF for later use!

Try unrolling a thread yourself!

how to unroll video
  1. Follow @ThreadReaderApp to mention us!

  2. From a Twitter thread mention us with a keyword "unroll"
@threadreaderapp unroll

Practice here first or read more on our help page!

More from @dhmontgomery

7 Aug
1/ No new #COVID19 data today, so here’s a thread summarizing my newsletter yesterday: why I think MN’s current #COVID19 wave is going to peak, soon.

Read the whole thing here, or follow along below!

view.connect.mpr.org/?qs=ec8caeee88…
2/ Here’s the big picture: #COVID19 cases are up everywhere, but in Minnesota they’re up like 1.5x, while the hardest-hit states are up 10x or more.

The biggest Q: is MN going to belatedly follow these hard-hit states with time? Or is our wave qualitatively different? Image
3/ So far MN’s current wave looks a lot like our Spring 2021 wave (a relatively slow climb) rather than the exponential spikes of the 2020 waves (and of many southern states now).

But that’s no guarantee it’ll STAY gradual. Maybe delta will find another gear? Image
Read 17 tweets
6 Aug
Not much new in today’s #COVID19 data — the same disquieting trends are continuing, without meaningful slowing or acceleration. Cases are up to about 730/day, positivity 4.3%. ImageImage
Hospital admissions are still rising, though not at levels like what we saw in past waves (as one would expect with most vulnerable people vaccinated). Image
It was about this time in the Spring 2021 wave that case growth started to peak.

The 2020 waves peaked about a week later.

So it wouldn’t be surprising if we’re within a week of peaking. But past trends are not guaranteed to continue! Image
Read 6 tweets
5 Aug
Minnesota’s #COVID19 outbreak continues to grow, up to an average of nearly 700 confirmed cases per day, and a 4.2% positivity rate. Image
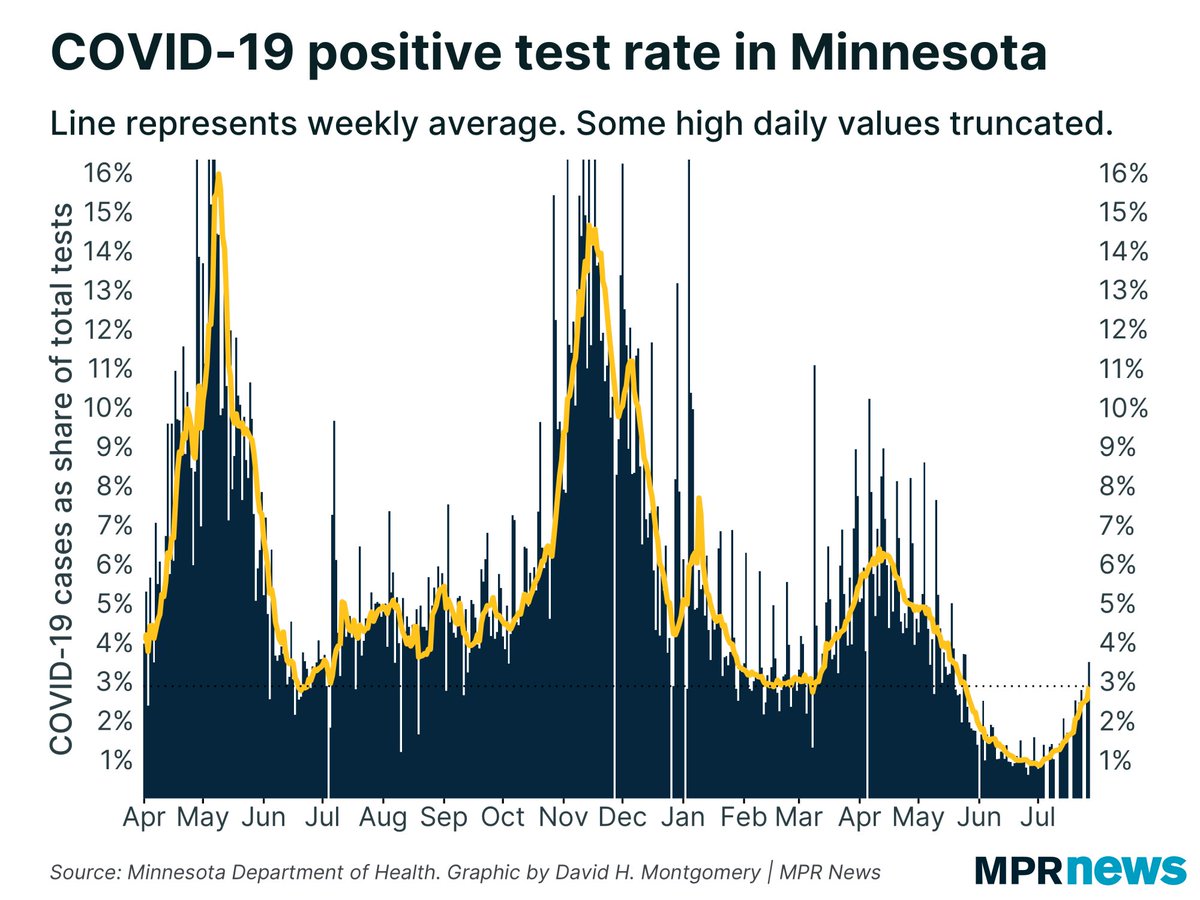
Here’s how the Summer 2021 compares to past waves in terms of positivity rate. If — IF — this wave takes more than 6 weeks to peak, we’ve got a decent chance of surpassing the Spring 2021 wave. Image
Every day someone replies two or three tweets in to my daily thread asking if I’m going to share some basic stat that I share almost every day.

PATIENCE PEOPLE. The graphs will come!
Read 4 tweets
28 Jul
Today’s #COVID19 data is not good — not only are cases continuing to grow, as expected, but there are signs that that growth is accelerating. Too early to say for sure, but the last two days of reports suggest the fourth wave may have found another gear…
Today reported 625 newly confirmed cases. That’s more than double last Wednesday’s 278.

The weekly average is up to 400/day, from 233/day a week ago.

Over the last two weeks, positivity rates have nearly tripled; cases have nearly quadrupled; hospitalizations nearly doubled.
It’s just a few days of data so far, but you can see the trajectory change in our current positivity line — eerily mirroring, at a lower base, the shape of the fall wave. (Again: too early to make conclusive judgments!)
Read 8 tweets
27 Jul
I've always been a little bit confused by the Google Reader nostalgia, but maybe that's because I just immediately exported my RSS feeds to Feedly, and continue to subscribe to dozens of feeds today.

But GR's demise probably did make it harder for new people to get into RSS...
I think this piece by @katiebakes gets into some of that — the demise of Google Reader was perhaps more symptom than cause of the death of the old blogosphere and surrounding “good internet.”
@katiebakes Here’s what I wonder: how much of the demise of Internet 2.0 was supply-side (companies like Google changing their offerings toward walled gardens) and how much was demand side (lots of new people spending more time online)
Read 4 tweets
27 Jul
Today is a Tuesday, which means @mnhealth is reporting 3 days of data today. So don’t freak out over the 1,032 new cases reported today.

Cases ARE rising, which is bad, but more modestly. Over the past week we’re averaging 350 cases per day, up from 220 cases per day last Tues.
@mnhealth MN’s positivity rate is up to 2.87% — until quite recently, record-low territory — from 2.0% a week ago.
@mnhealth #COVID19 hospital admissions are up, but only modestly so far.
Read 10 tweets

Did Thread Reader help you today?

Support us! We are indie developers!


This site is made by just two indie developers on a laptop doing marketing, support and development! Read more about the story.

Become a Premium Member ($3/month or $30/year) and get exclusive features!

Become Premium

Too expensive? Make a small donation by buying us coffee ($5) or help with server cost ($10)

Donate via Paypal Become our Patreon

Thank you for your support!

Follow Us on Twitter!

:(