1/ No new #COVID19 data today, so here’s a thread summarizing my newsletter yesterday: why I think MN’s current #COVID19 wave is going to peak, soon.
Read the whole thing here, or follow along below!
view.connect.mpr.org/?qs=ec8caeee88…
Read the whole thing here, or follow along below!
view.connect.mpr.org/?qs=ec8caeee88…
2/ Here’s the big picture: #COVID19 cases are up everywhere, but in Minnesota they’re up like 1.5x, while the hardest-hit states are up 10x or more.
The biggest Q: is MN going to belatedly follow these hard-hit states with time? Or is our wave qualitatively different?
The biggest Q: is MN going to belatedly follow these hard-hit states with time? Or is our wave qualitatively different?

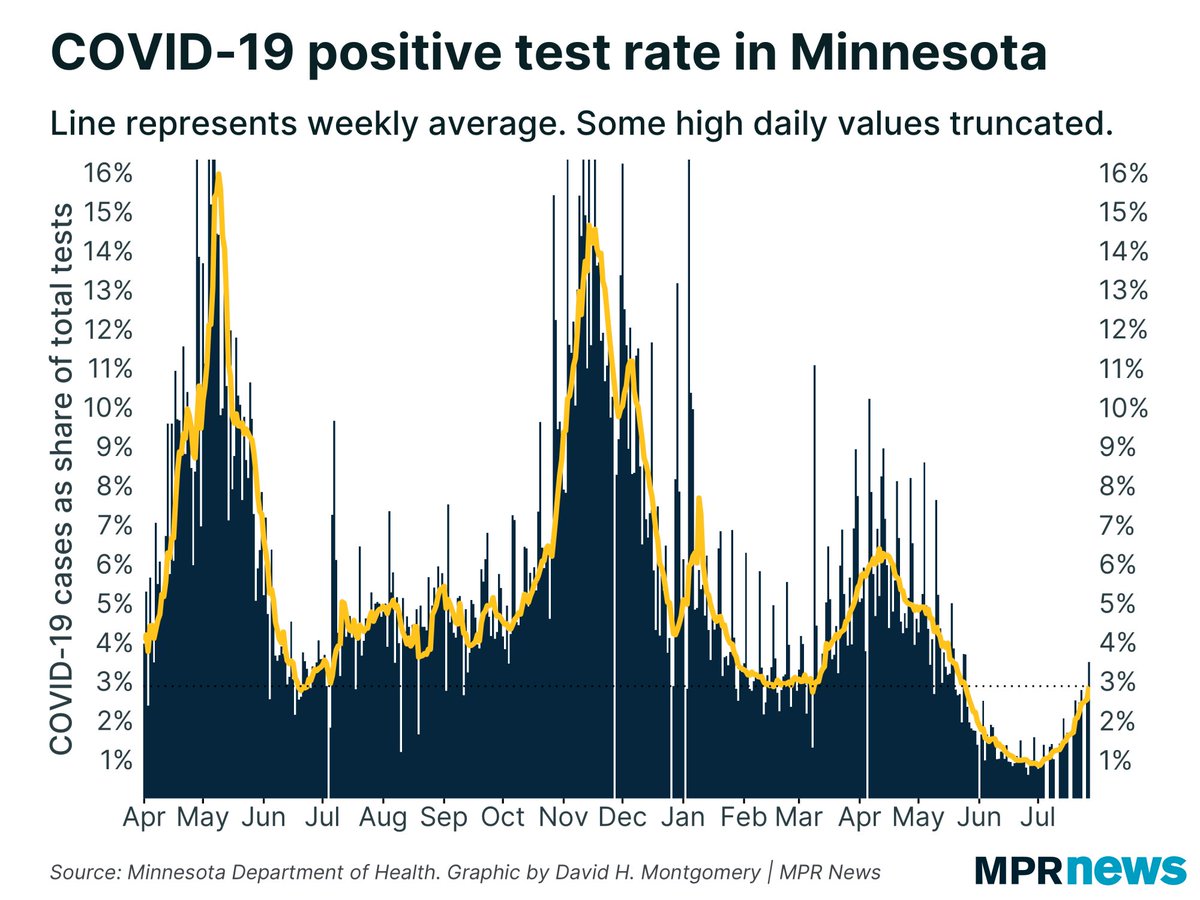
3/ So far MN’s current wave looks a lot like our Spring 2021 wave (a relatively slow climb) rather than the exponential spikes of the 2020 waves (and of many southern states now).
But that’s no guarantee it’ll STAY gradual. Maybe delta will find another gear?
But that’s no guarantee it’ll STAY gradual. Maybe delta will find another gear?

4/ But something struck me looking at this chart, of percent growth in key #COVID19 metrics in MN. Look at how that green positivity line is moving DOWN.
MN’s positivity rate is still rising, but in recent days it’s been rising more slowly…
MN’s positivity rate is still rising, but in recent days it’s been rising more slowly…

5/ This doesn’t necessarily mean anything anything. Maybe we’re seeing a little slowdown now but will get back to acceleration next week.
So I took a look at this metric in the past. Once positivity growth has started to slow, has it kept slowing? Or has it bounced around?
So I took a look at this metric in the past. Once positivity growth has started to slow, has it kept slowing? Or has it bounced around?
6/ Here you can see the change in positivity rate for all four of MN’s waves. Note this isn’t a graph of *positivity*, it’s a graph of the *change in positivity* (the 1st derivative, if you remember HS calculus). Below 0 means positivity is declining. Moving down means slowing.

7/ With the limited exception of the first wave (for which data is a little dodgy), once positivity rate growth has started to slow for more than a few days, it has *kept going down*.
That implies — if patterns hold, a big if — MN is already approaching a peak.
That implies — if patterns hold, a big if — MN is already approaching a peak.

8/ Now we don’t know if positivity growth will continue to slow, and if so at what rate. The Fall 2020 wave had a sharp peak and decline; the Spring 2021 wave went down gradually & then quickly. So far we look more like the fall, though that’s no guarantee we’ll keep doing so.

9/ So here’s what it looks like if you take MN’s trend in positivity growth & extend it linearly into the future.
Again, this is positivity growth, not positivity — getting to 0 here means we peak, & positivity starts going down.
My prediction: peak on Wednesday Aug. 18
Again, this is positivity growth, not positivity — getting to 0 here means we peak, & positivity starts going down.
My prediction: peak on Wednesday Aug. 18

10/ Now obviously this is based on *current trends continuing* and there’s no guarantee of that! We could peak sooner or later — or much later. I’ll certainly circle back judge how this prediction holds up.
11/ As progressives have been ceaselessly replying to me since this thread began, there ARE upcoming big gatherings of people that could change these trends: Sturgis, the State Fair, Labor Day cookouts, the start of school.
12/ It is entirely possible that these big gatherings will arrest this wave’s current slowdown and kick us back to exponential growth. I don’t know the future, and I acknowledge this as a possibility.
13/ That said, people saying “you can’t assume this wave will behave like past waves because we don’t have mitigation efforts this time” are right but oversimplifying.
It’s true we don’t have mask mandates now. We also have much higher immunity levels than we did. It’s complex!
It’s true we don’t have mask mandates now. We also have much higher immunity levels than we did. It’s complex!
14/ My working hypothesis is that this wave will behave like past waves. Lots of things are different, but some in ways that might accelerate spread and some in ways that might slow it.
15/ One past observation worth noting is this:
In the fall wave, cases/positivity peaked in late November & started to fall. But right after Christmas there was a significant but brief roadbump.
In the fall wave, cases/positivity peaked in late November & started to fall. But right after Christmas there was a significant but brief roadbump.

16/ It’s also worth noting that a mild summer wave is no guarantee MN won’t see a big fall wave, as we did last year. This is what the Seasonality Squad is predicting, and maybe they’ll be right. Or maybe rising immunity from vaccination & infection will change things.
17/ In any case, that’s my hypothesis: that the current COVID wave will behave generally like past waves, that we’re already approaching the peak, and will hit it in around 12 days.
I’ll update you on how this prediction turns out!
Read more: view.connect.mpr.org/?qs=ec8caeee88…
I’ll update you on how this prediction turns out!
Read more: view.connect.mpr.org/?qs=ec8caeee88…
• • •
Missing some Tweet in this thread? You can try to
force a refresh