This earnings season the market is adjusting post covid. Seems like we are back to a stock pickers market. One of the important variables to look for is multiple expansion.
The following graph is a comparison of this metric for some companies pre and post pandemic.
The following graph is a comparison of this metric for some companies pre and post pandemic.

To calculate the multiple expansion of each company, I compared the average multiple of every quarter from 2018-2019 vs today, using the following metrics:
- EV/GP
- EV/EBITDA
- EV/FCF
This has some limitations as multiples in 2018-2019 may be considered high or low.
- EV/GP
- EV/EBITDA
- EV/FCF
This has some limitations as multiples in 2018-2019 may be considered high or low.
But I wanted to get an estimate of how the pandemic and its consequences have affected valuations.
I used only positive metrics, so if FCF or EBITDA multiples were negative, I excluded those from the average. Gross profit was always used.
I used only positive metrics, so if FCF or EBITDA multiples were negative, I excluded those from the average. Gross profit was always used.
This is a consolidated graph of the total performance for the last 3 years of the same companies (or since IPO for new public companies that have less than 3 years of data)

The next graphs are a comparison of multiple expansion vs performance in the last 3 years by industry.
There are some with greater correlation than others, as you will see. I hope you find it interesting.
There are some with greater correlation than others, as you will see. I hope you find it interesting.
E-Commerce
Multiple expansion / 3-year performance
$SE 143% / 1923%
$JD 29% / 97%
$SHOP 17% / 996%
$W 13% / 125%
$ETSY 10% / 300%
$AMZN 8% / 84%
$MELI -6% / 357%
$PDD -19% / 368%
$BABA -23% / 11%
These have gone down the past few weeks with earnings.
Multiple expansion / 3-year performance
$SE 143% / 1923%
$JD 29% / 97%
$SHOP 17% / 996%
$W 13% / 125%
$ETSY 10% / 300%
$AMZN 8% / 84%
$MELI -6% / 357%
$PDD -19% / 368%
$BABA -23% / 11%
These have gone down the past few weeks with earnings.

Fintech and Payments
Multiple expansion / 3-year performance
$LSPD 87% / 492%
$PYPL 86% / 223%
$SQ 69% / 290%
$MA 26% / 86%
$V 23% / 72%
$MELI -6% / 357%
Multiple expansion / 3-year performance
$LSPD 87% / 492%
$PYPL 86% / 223%
$SQ 69% / 290%
$MA 26% / 86%
$V 23% / 72%
$MELI -6% / 357%

Social Media and Digital Ads
Multiple expansion / 3-year performance
$MGNI 262% / 773%
$TTD 138% / 840%
$ROKU 123% / 804%
$TWTR 81% / 115%
$SNAP 76% / 504%
$GOOGL 25% / 118%
$PINS 15% / 146%
$FB 6% / 102%
Multiple expansion / 3-year performance
$MGNI 262% / 773%
$TTD 138% / 840%
$ROKU 123% / 804%
$TWTR 81% / 115%
$SNAP 76% / 504%
$GOOGL 25% / 118%
$PINS 15% / 146%
$FB 6% / 102%

Mega Cap
Multiple expansion / 3-year performance
$TSLA 182% / 920%
$AAPL 95% / 192%
$NVDA 69% / 218%
$MSFT 49% / 175%
$GOOGL 25% / 118%
$AMZN 8% / 84%
$BABA -23% / 11%
$NFLX -24% / 51%
$TCEHY -26% / 32%
Multiple expansion / 3-year performance
$TSLA 182% / 920%
$AAPL 95% / 192%
$NVDA 69% / 218%
$MSFT 49% / 175%
$GOOGL 25% / 118%
$AMZN 8% / 84%
$BABA -23% / 11%
$NFLX -24% / 51%
$TCEHY -26% / 32%

SAAS
Multiple expansion / 3-year performance
$NET 277% / 567%
$TEAM 108% / 360%
$MDB 92% / 527%
$TWLO 56% / 504%
$VEEV 56% / 328%
$OKTA 51% / 367%
$CRWD 46% / 312%
$NOW 45% / 228%
$ADBE 45% / 147%
$DOCU 35% / 430%
$CRM 17% / 73%
$PD 8% / 7%
$ZM -38% / 546%
Multiple expansion / 3-year performance
$NET 277% / 567%
$TEAM 108% / 360%
$MDB 92% / 527%
$TWLO 56% / 504%
$VEEV 56% / 328%
$OKTA 51% / 367%
$CRWD 46% / 312%
$NOW 45% / 228%
$ADBE 45% / 147%
$DOCU 35% / 430%
$CRM 17% / 73%
$PD 8% / 7%
$ZM -38% / 546%

Real Estate / Healthcare / Gig Economy / Other
Multiple expansion / 3-year performance
$FVRR 309% / 465%
$UPWK 75% / 144%
$PTON 70% / 379%
$AMD 35% / 542%
$RDFN 24% / 152%
$Z 18% / 88%
$TDOC 0% / 140%
This includes Fiverr pullback today.
Multiple expansion / 3-year performance
$FVRR 309% / 465%
$UPWK 75% / 144%
$PTON 70% / 379%
$AMD 35% / 542%
$RDFN 24% / 152%
$Z 18% / 88%
$TDOC 0% / 140%
This includes Fiverr pullback today.

Some thoughts:
1. Multiple expansion is influenced by variables such as the change in interest rates, growth, TINA effect, current liquidity in the markets, and other company specific aspects.
Before Covid, the 10-yr rate was around 2.3%. It got as low as 0.52% in August 20.
1. Multiple expansion is influenced by variables such as the change in interest rates, growth, TINA effect, current liquidity in the markets, and other company specific aspects.
Before Covid, the 10-yr rate was around 2.3%. It got as low as 0.52% in August 20.

2. Most of these companies have seen their fundamentals grow and many have been favored by the effects of the pandemic.
However, multiple expansion has played some role in the total performance of most of these companies.
However, multiple expansion has played some role in the total performance of most of these companies.
3. This quarter and for the next couple of quarters, many companies face tough comparisons YoY.
The market is forward looking and trying to adjust the valuation and multiples now that growth has slowed compared to last year.
The market is forward looking and trying to adjust the valuation and multiples now that growth has slowed compared to last year.
I hope you found this thread useful.
If you did, you might find interesting some of the previous threads I have shared recently. You can see them below.
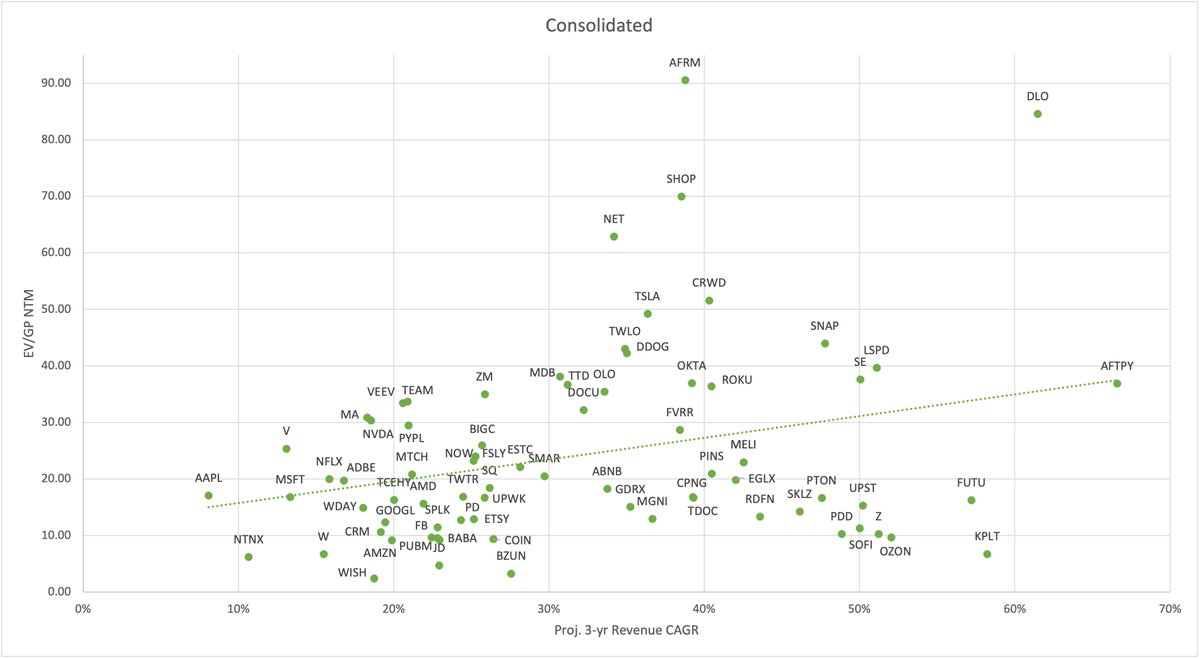
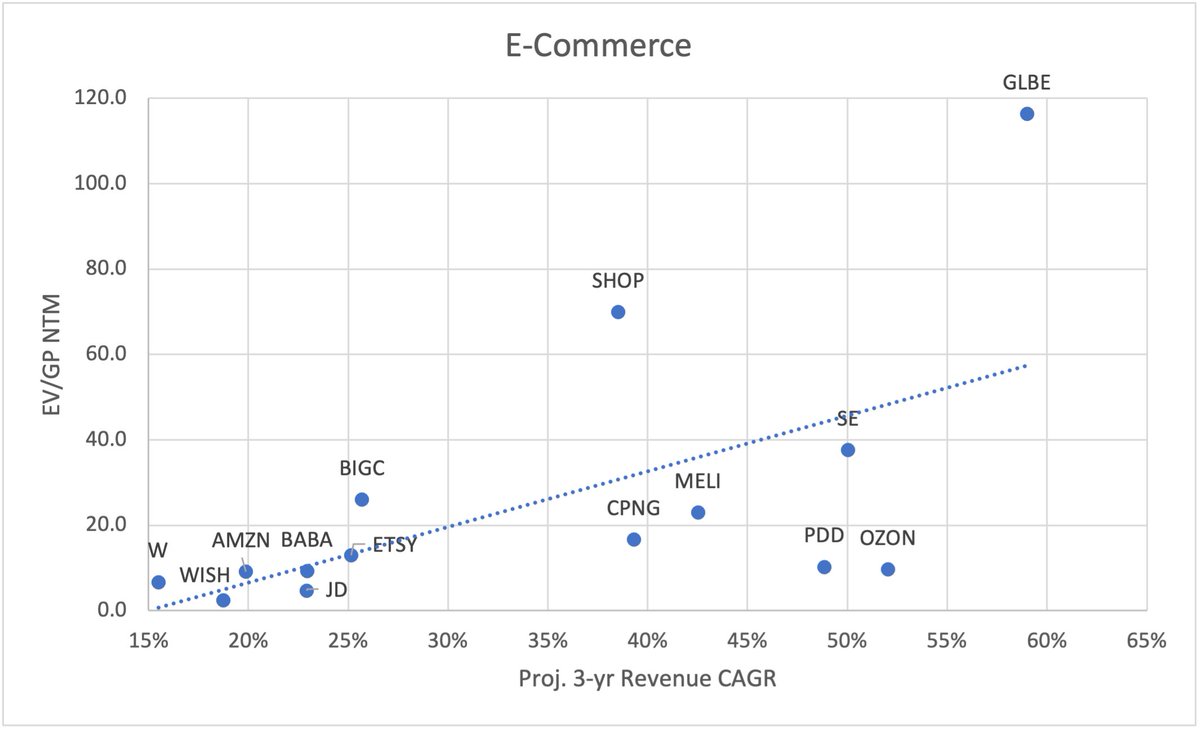
On this one I shared graphs comparing current EV/GP NTM with projected 3-yr revenue CAGR.
If you did, you might find interesting some of the previous threads I have shared recently. You can see them below.
On this one I shared graphs comparing current EV/GP NTM with projected 3-yr revenue CAGR.
https://twitter.com/Investing_Lion/status/1415653929745059843?s=20
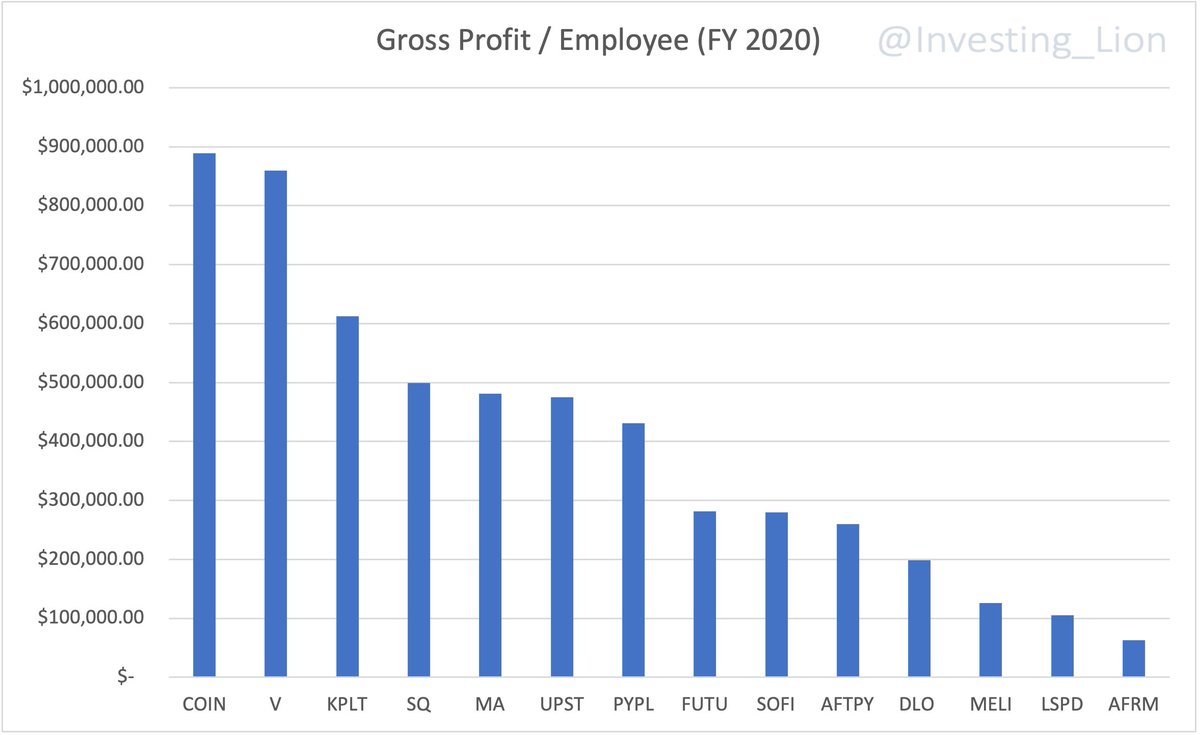
On this other thread, we look at a comparison between Gross Profit and the number of employees to see which companies have the highest GP / Employee ratio.
https://twitter.com/Investing_Lion/status/1419018941809188867?s=20
And finally, this is a personal analysis of my assessment of quality score for many of these companies.
This is the only subjective thread as it is my personal opinion based on factors that are important to me. It may change over time.
This is the only subjective thread as it is my personal opinion based on factors that are important to me. It may change over time.
https://twitter.com/Investing_Lion/status/1409306811157598214?s=20
Thank you for your time. Hope you find it useful! 👍
@Soumyazen @InvestmentTalkk @OphirGottlieb @qcapital2020 @caleb_investTML @EugeneNg_VCap @JoshuaTai0427 @BahamaBen9 @adventuresinfi @BackpackerFI
@Soumyazen @InvestmentTalkk @OphirGottlieb @qcapital2020 @caleb_investTML @EugeneNg_VCap @JoshuaTai0427 @BahamaBen9 @adventuresinfi @BackpackerFI
• • •
Missing some Tweet in this thread? You can try to
force a refresh