
For every topic in computer science, there is an XKCD comic that summarizes it perfectly. My all-time favorite one is the following.
Jokes aside, linear algebra plays a crucial part in machine learning. Here is why!
(image credit: @xkcd, original: xkcd.com/1838/)
Jokes aside, linear algebra plays a crucial part in machine learning. Here is why!
(image credit: @xkcd, original: xkcd.com/1838/)

In essence, a machine learning model works by doing the following two things.
1. Find an alternative representation of the data.
2. Make decisions based on this representation.
Linear algebra plays a role in the representations.
1. Find an alternative representation of the data.
2. Make decisions based on this representation.
Linear algebra plays a role in the representations.
Regardless of the features, data points are represented by vectors.
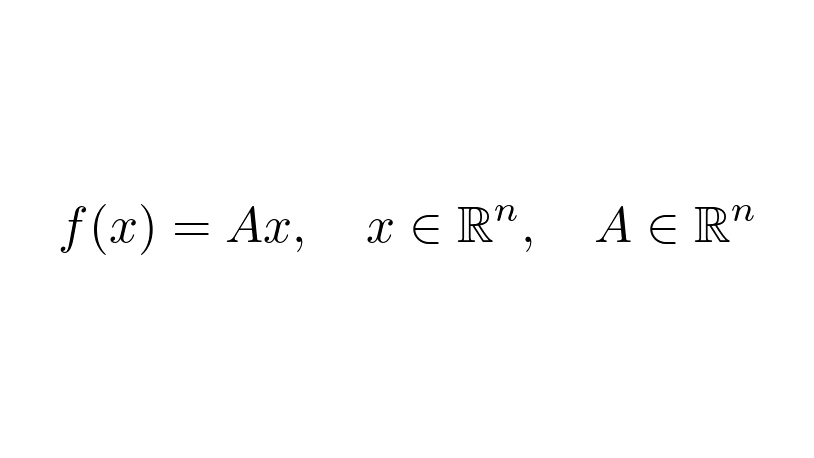
Finding more descriptive representations is the same as finding functions f(x), mapping between vector spaces.
The simplest ones are the linear transformations given by matrices.
Finding more descriptive representations is the same as finding functions f(x), mapping between vector spaces.
The simplest ones are the linear transformations given by matrices.
Why do we love linear transformations? There are two reasons.
• They are easy to work with and fast to compute.
• Combined with simple nonlinear functions, they can create expressive models.
What is their effect on the data? We'll see this next.
• They are easy to work with and fast to compute.
• Combined with simple nonlinear functions, they can create expressive models.
What is their effect on the data? We'll see this next.
Linearity means that the order of addition, scalar multiplication, and function application can be changed.
So, a linear transformation is determined by the images of the basis vectors.
So, a linear transformation is determined by the images of the basis vectors.

We can visualize this for linear transformations on the two-dimensional plane.
As you can see, the images of the basis vectors form a parallelogram. (Whose sides can fall onto a single line.)
As you can see, the images of the basis vectors form a parallelogram. (Whose sides can fall onto a single line.)

From yet another perspective, this is the same as distorting the grid determined by the basis vectors.

How does this help to find good representations of the data?
Think about PCA, which finds features with no redundancy. This is done by a simple linear transformation. (If you are not familiar with how PCA works, here is a thread I posted earlier.)
Think about PCA, which finds features with no redundancy. This is done by a simple linear transformation. (If you are not familiar with how PCA works, here is a thread I posted earlier.)
https://twitter.com/TivadarDanka/status/1387399961143353347
So, linear transformations give rise to new features. How descriptive can these be?
For instance, in classification tasks, we want each high-level feature to represent the probability of belonging to a given class. Are linear transformations enough to express this?
Almost.
For instance, in classification tasks, we want each high-level feature to represent the probability of belonging to a given class. Are linear transformations enough to express this?
Almost.
Any true underlying relationship between data and class label can be approximated by composing linear transformations with certain nonlinear functions (such as the Sigmoid or ReLU).
This is formally expressed by the Universal Approximation Theorem.
This is formally expressed by the Universal Approximation Theorem.
https://twitter.com/TivadarDanka/status/1365319054425288709
This is why machine learning is just a pile of linear algebra, stirred until it looks right. (Not just accordingly to XKCD.)
In summary, linear transformations are
• simple to work with,
• fast to compute,
• and can be used to build powerful models.
In summary, linear transformations are
• simple to work with,
• fast to compute,
• and can be used to build powerful models.
If you enjoy my explanations of math in machine learning, I regularly post them on my blog as well. Here is the written version of this thread!
tivadardanka.com/blog/linear-al…
tivadardanka.com/blog/linear-al…
• • •
Missing some Tweet in this thread? You can try to
force a refresh


