The Great Big Canadian Pandemic Summary Thread (5th edition)
First a summary of the pandemic in Canada.
Bonus analysis on pandemic outcomes in Canadian health regions and US counties
First a summary of the pandemic in Canada.
Bonus analysis on pandemic outcomes in Canadian health regions and US counties
You can find the previous four summaries here:
https://twitter.com/WilsonKM2/status/1378384597390659591
https://twitter.com/WilsonKM2/status/1388553023262269447
https://twitter.com/WilsonKM2/status/1398977678355668995
https://twitter.com/WilsonKM2/status/1411310071192199170
For all the graphs, I have the national range in the background in grey: the bottom is the lowest per capita rate by any health region and the top is the highest per capita rate.
So everything will be visible on the same scale.
Examples:
So everything will be visible on the same scale.
Examples:


BC
Early days for the new wave of cases in BC. The largest uptick in cases is in the Interior of the province so far, but it's high enough to drag up the entire provincial average.
Early days for the new wave of cases in BC. The largest uptick in cases is in the Interior of the province so far, but it's high enough to drag up the entire provincial average.


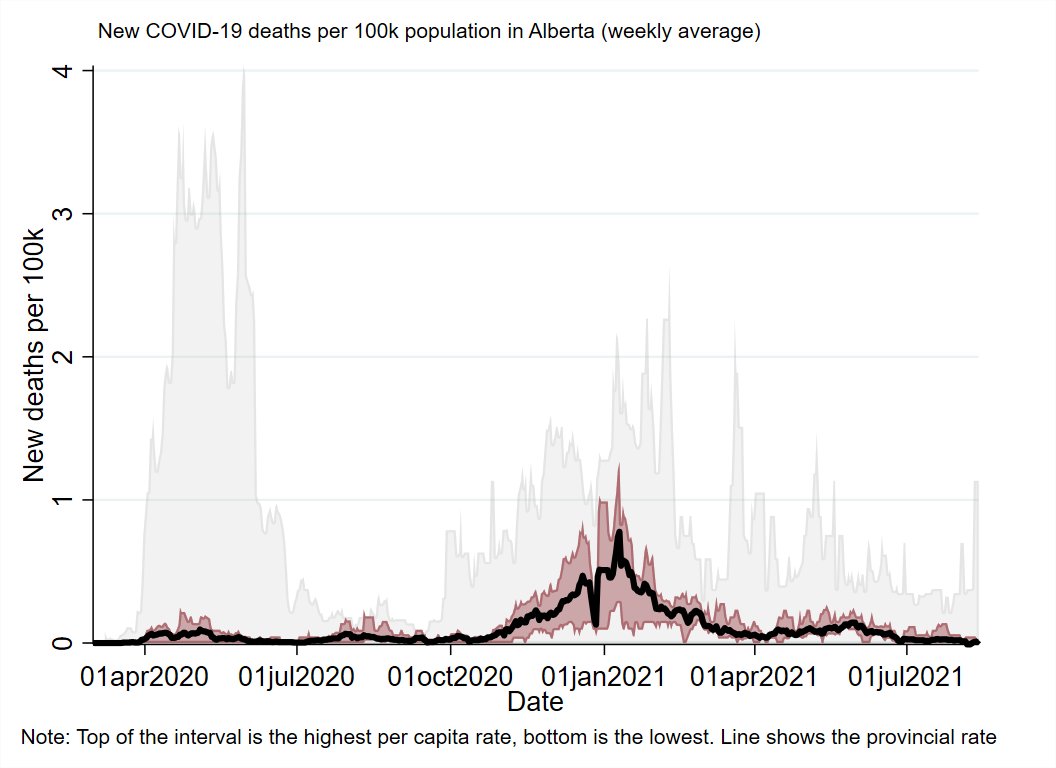
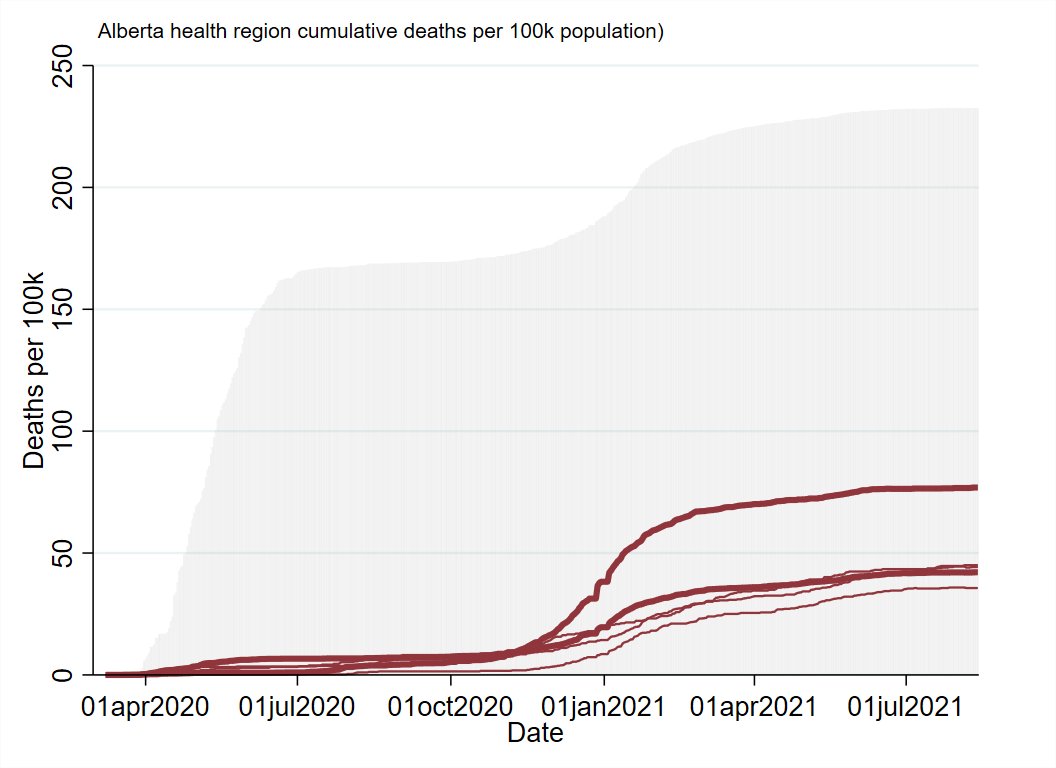
Alberta
Province continues its historic trend of all health regions moving up and down together.
Case growth evident in all health regions.
Province continues its historic trend of all health regions moving up and down together.
Case growth evident in all health regions.


Saskatchewan
Rolling, massive outbreak in the northern health regions of the province that they never really seem to get under control.
Signs of case growth in some parts of the south/more urban of the province.
Rolling, massive outbreak in the northern health regions of the province that they never really seem to get under control.
Signs of case growth in some parts of the south/more urban of the province.


Manitoba
Hasn't yet shown the same evidence of case growth as the previously mentioned provinces.
Hasn't yet shown the same evidence of case growth as the previously mentioned provinces.


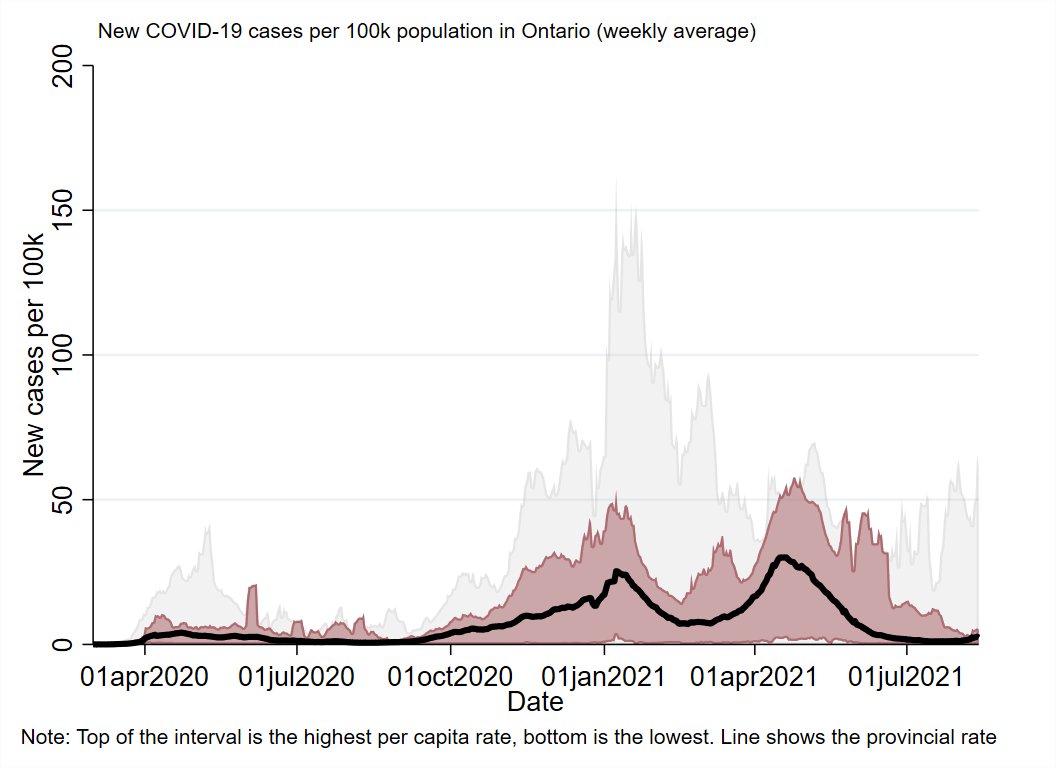
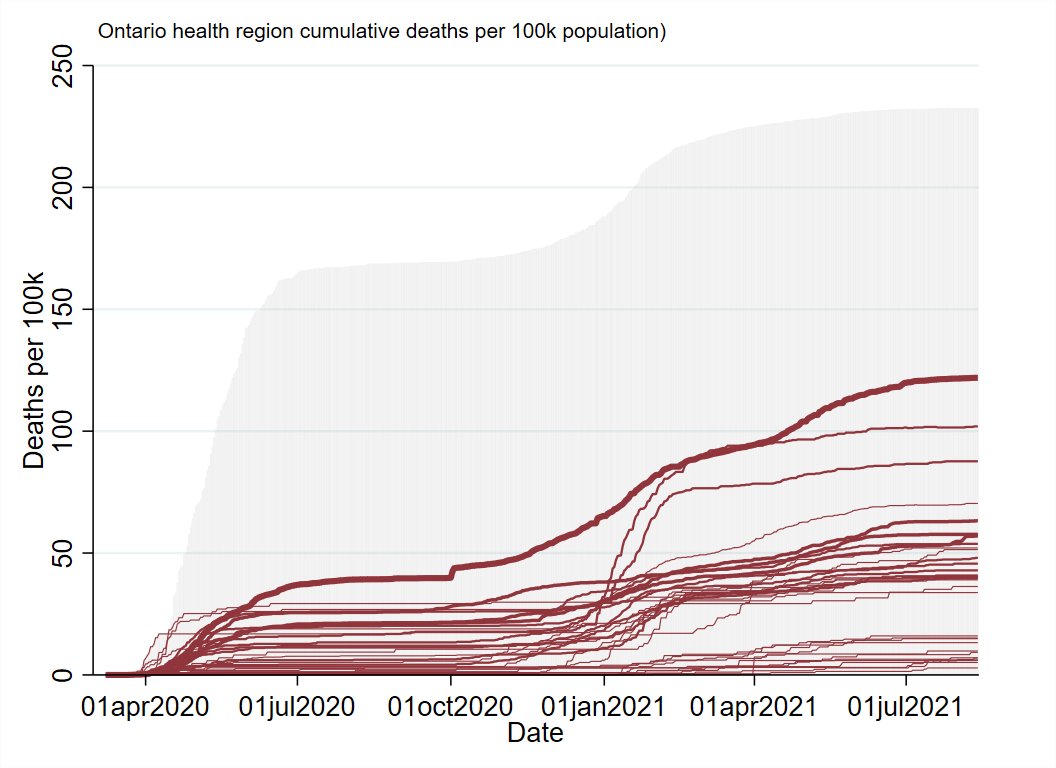
Ontario
Early signs of case growth, although not as obvious/large scale as in BC/Alberta.
Early signs of case growth, although not as obvious/large scale as in BC/Alberta.


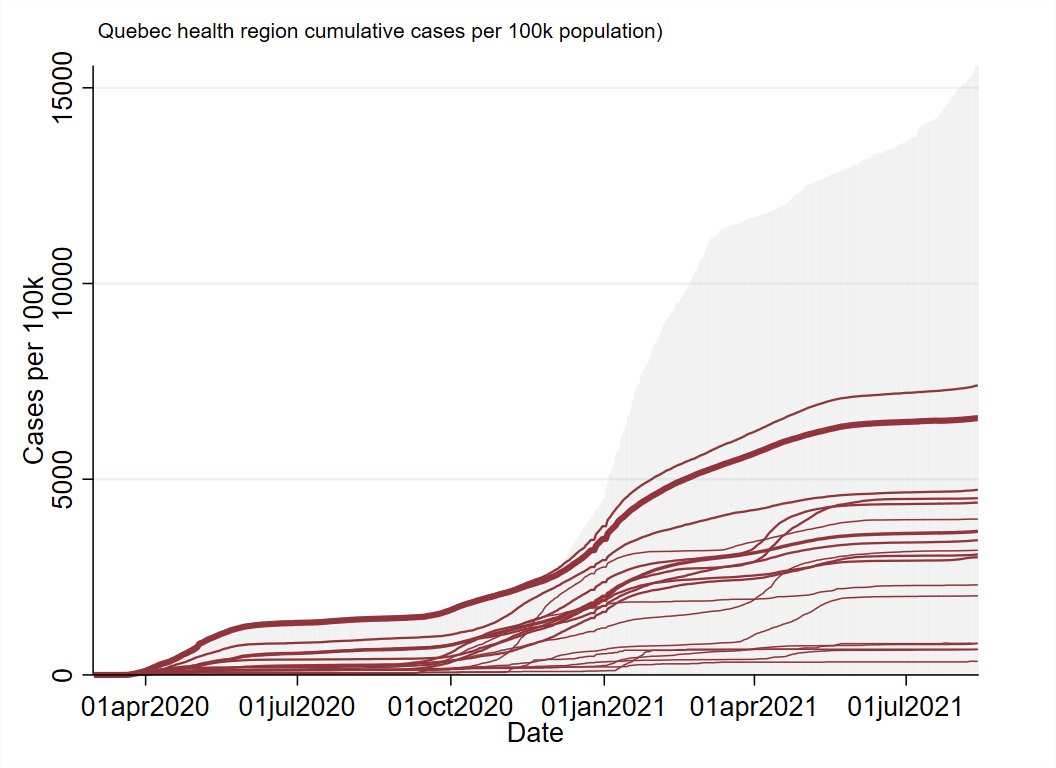
Quebec
Early signs of case growth (looks a lot like Ontario)
Early signs of case growth (looks a lot like Ontario)

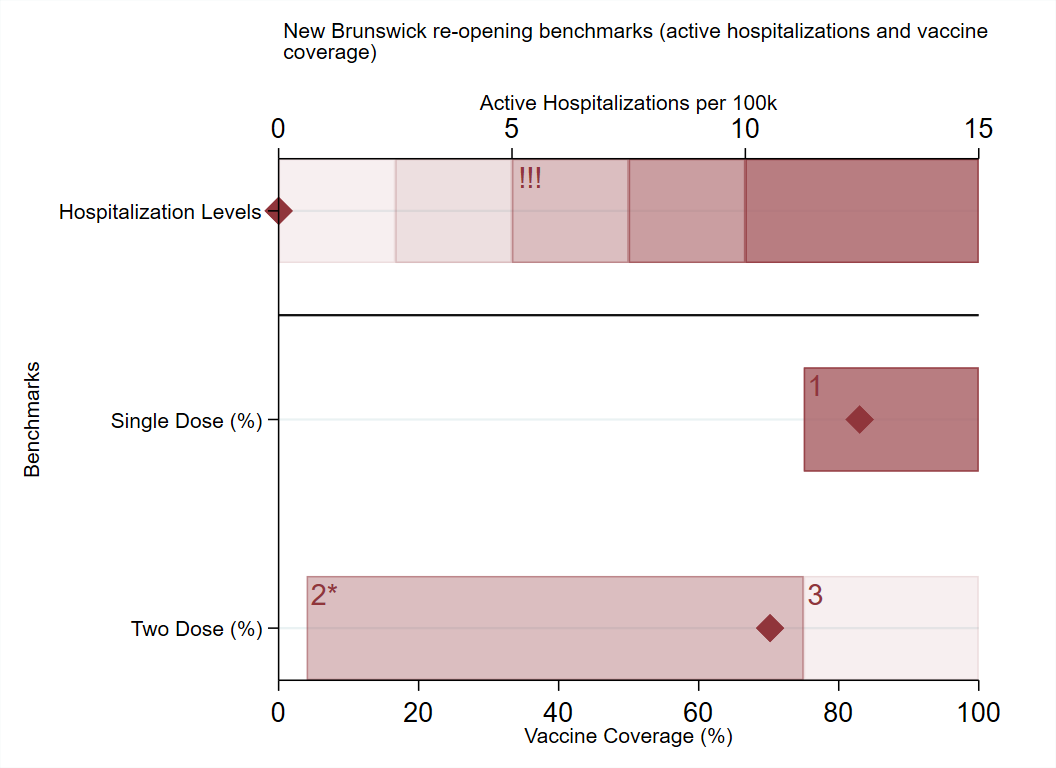
New Brunswick
Small outbreak in the Moncton area that doesn't really show up on the graph due to its small size.
Small outbreak in the Moncton area that doesn't really show up on the graph due to its small size.


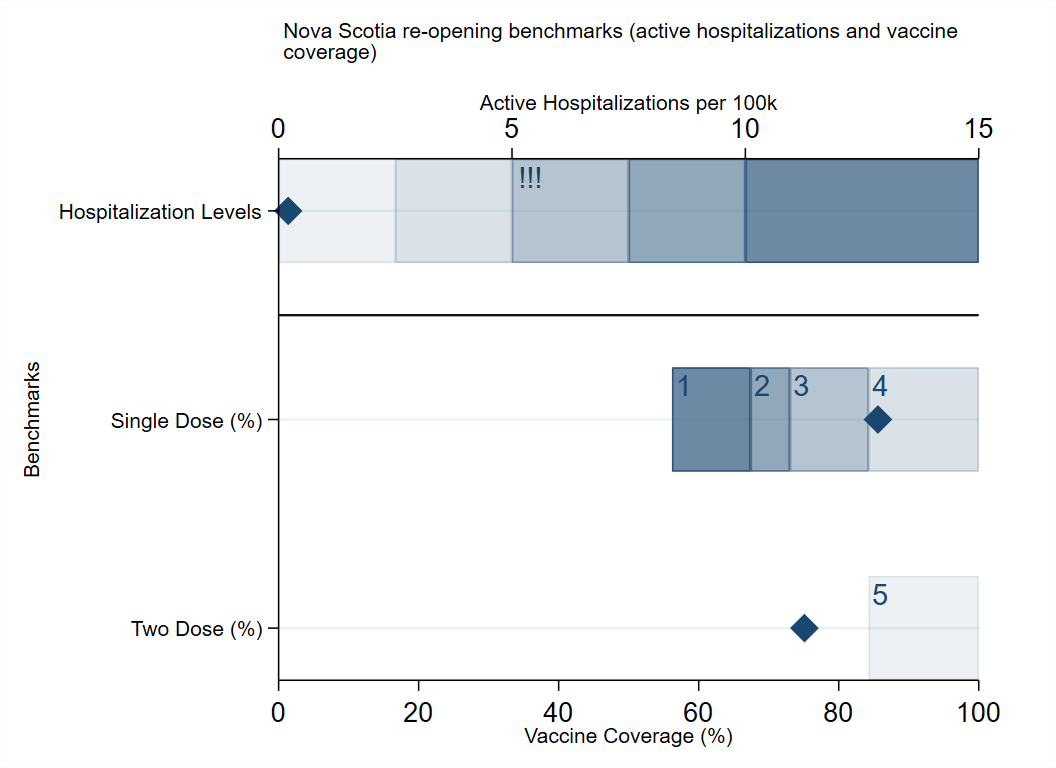
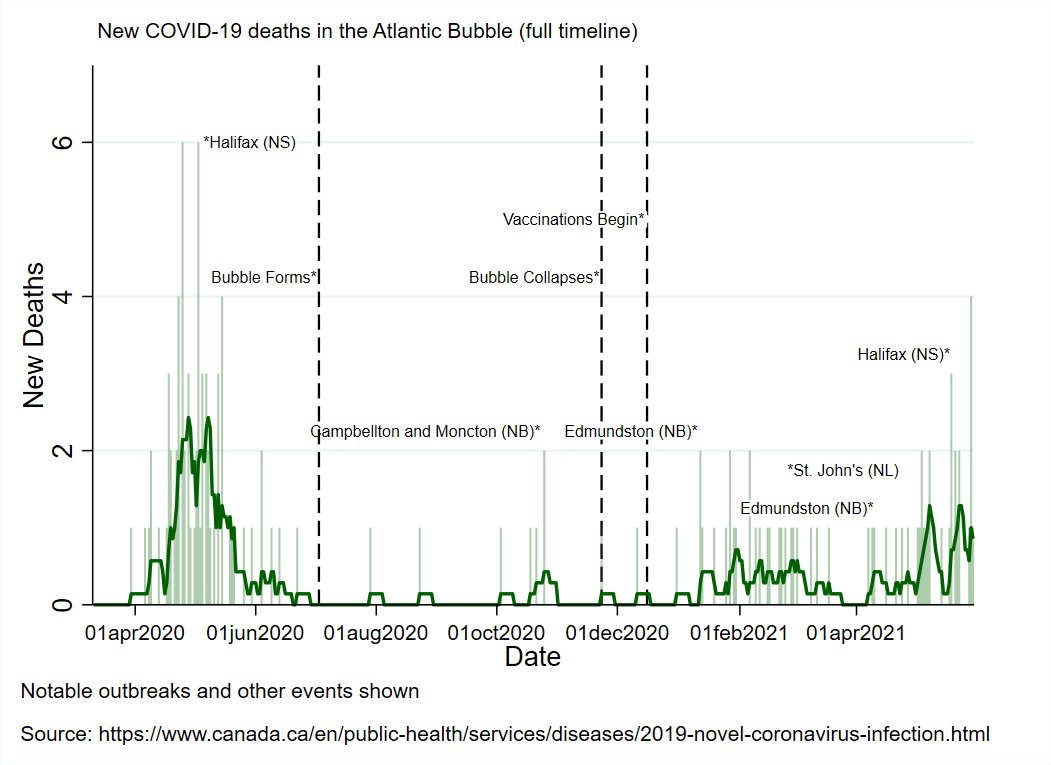
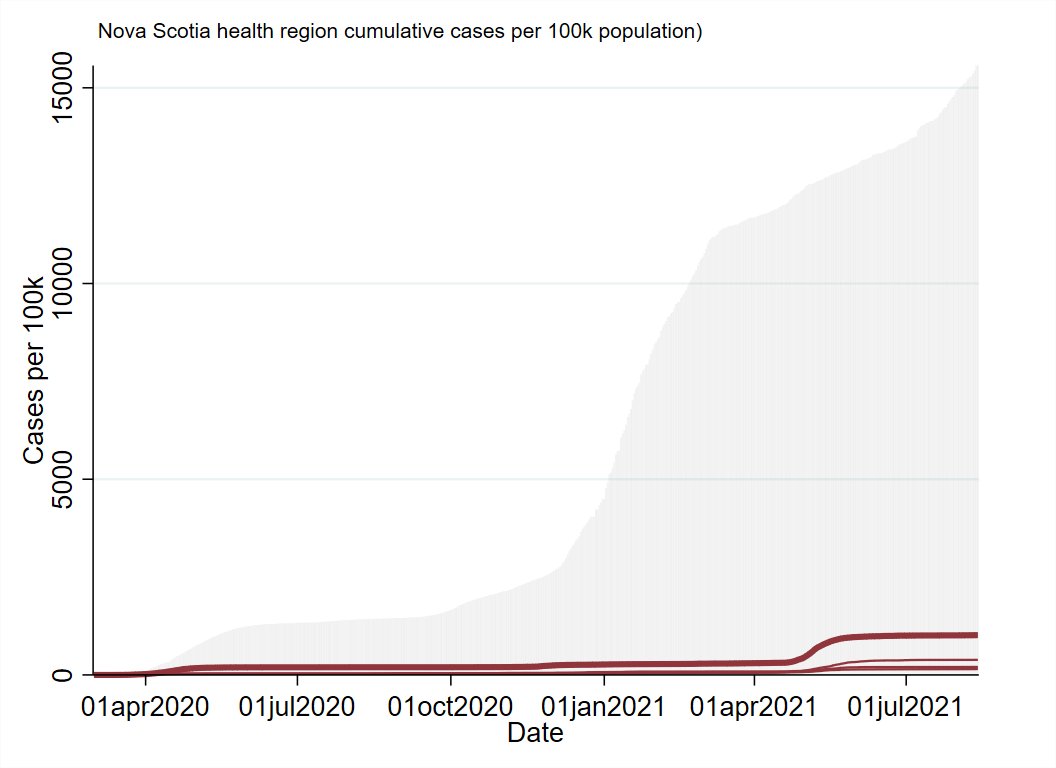
Nova Scotia
Currently quiet; no evidence of community transmission.
Currently quiet; no evidence of community transmission.


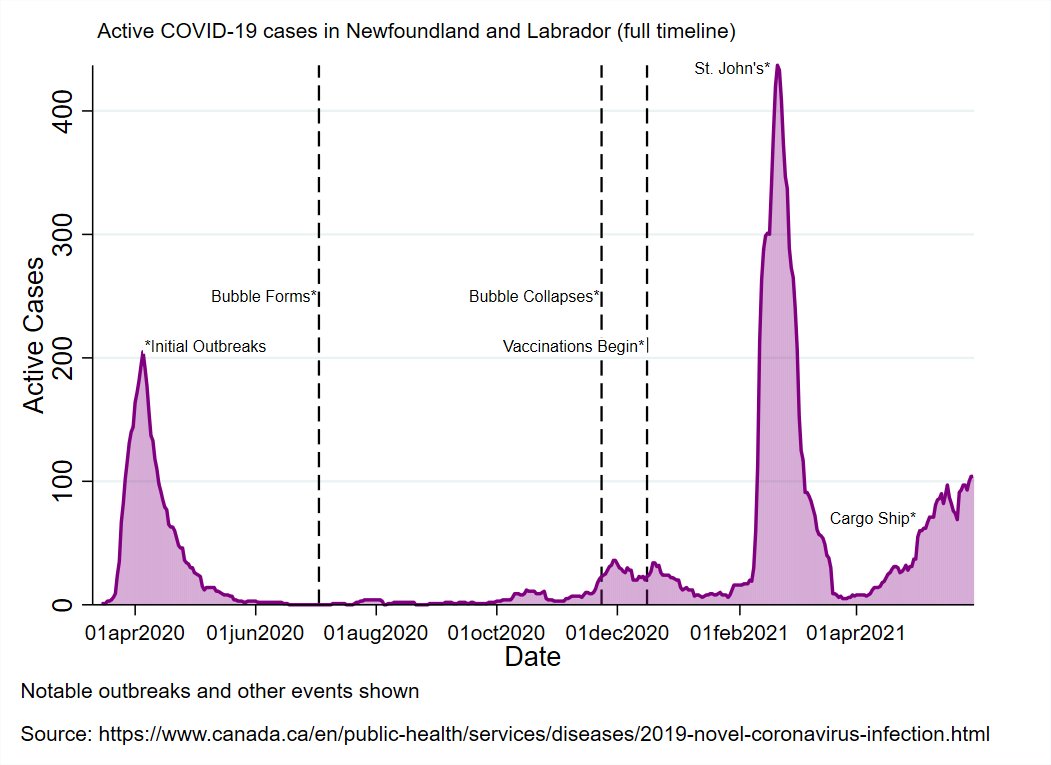
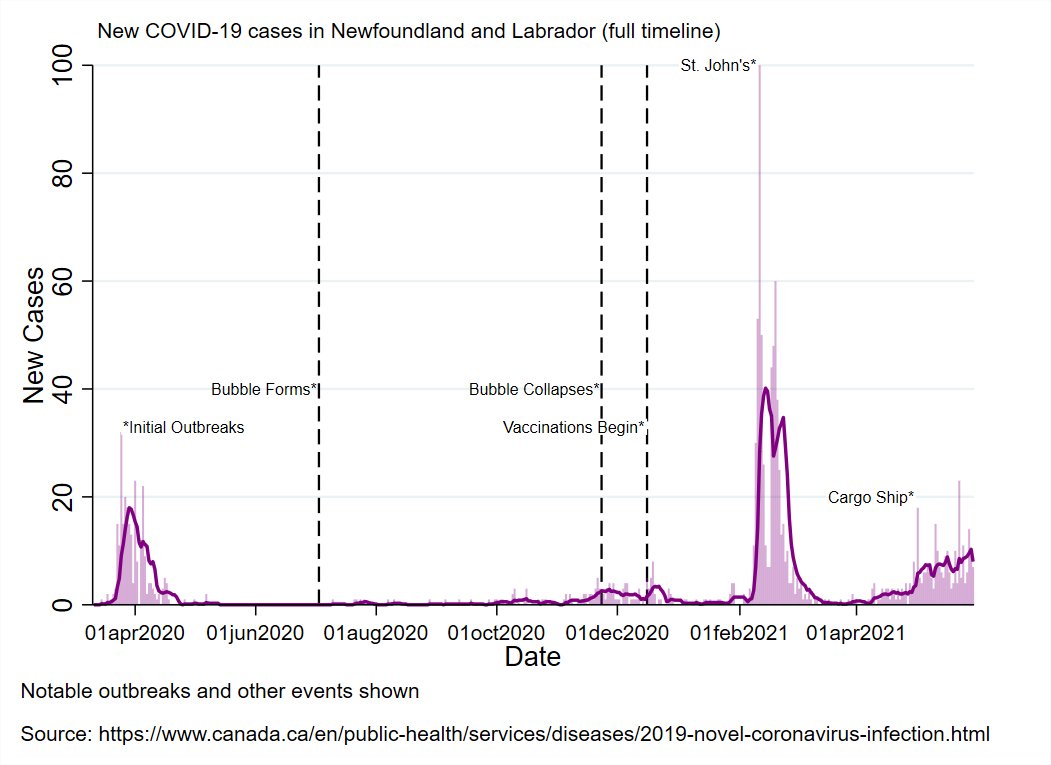
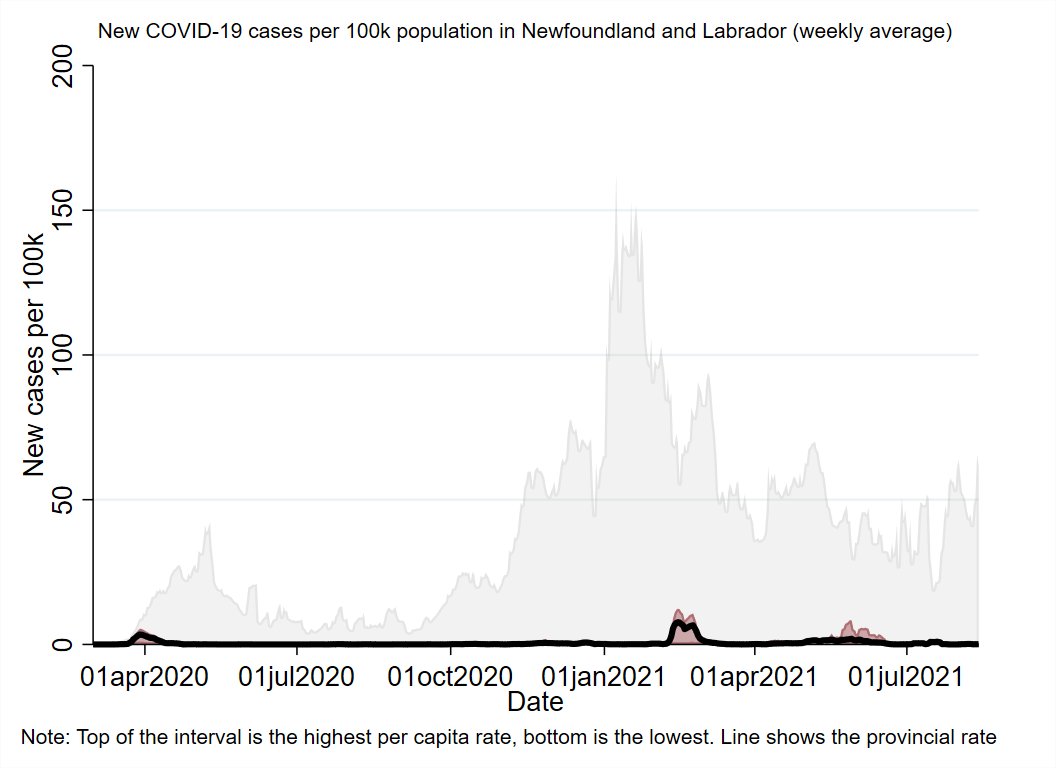
Newfoundland and Labrador
Likewise to NS, no known community transmission.
Likewise to NS, no known community transmission.
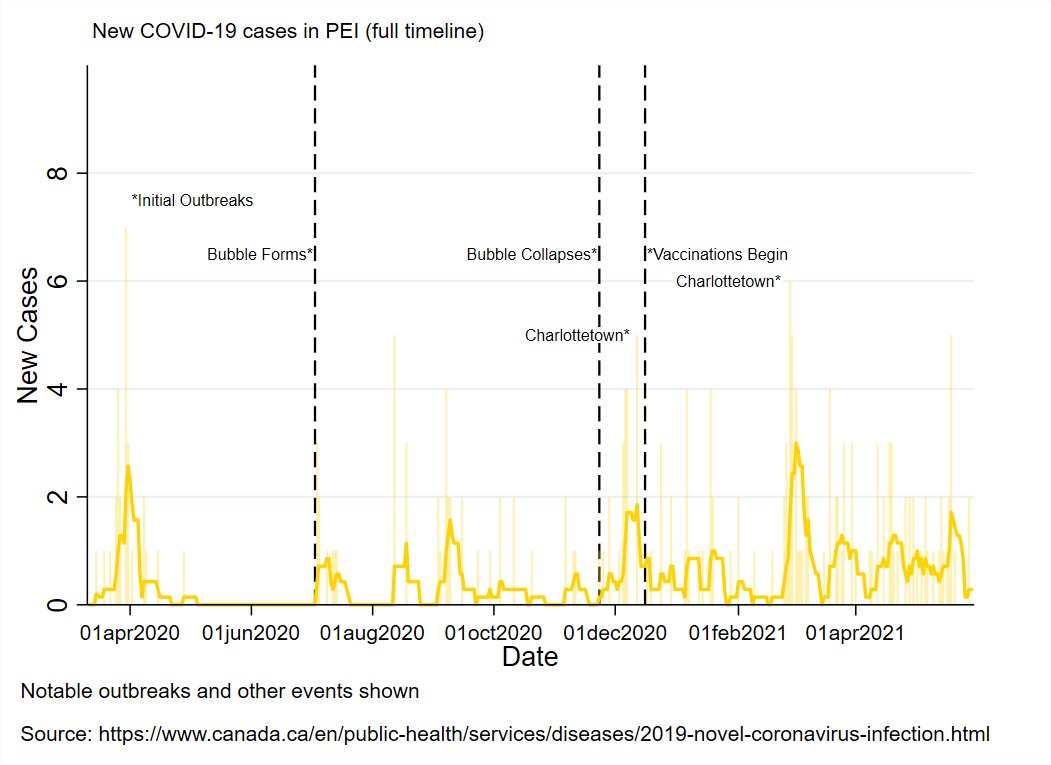
PEI continues to wisely not participate in the pandemic, having suffered no major outbreaks and no deaths to date,
*knocks on wood*
*knocks on wood*


Territories
Mostly quiet still.
Yukon is at the tail end of their summer outbreak, which has generated some deaths.
Mostly quiet still.
Yukon is at the tail end of their summer outbreak, which has generated some deaths.


That's it for the national summary.
I'll start the bonus analysis in a minute (attached to this thread).
It's basically a re-run of some of the analyses I've done before at the health region level, but adding in US county-level data.
I'll start the bonus analysis in a minute (attached to this thread).
It's basically a re-run of some of the analyses I've done before at the health region level, but adding in US county-level data.
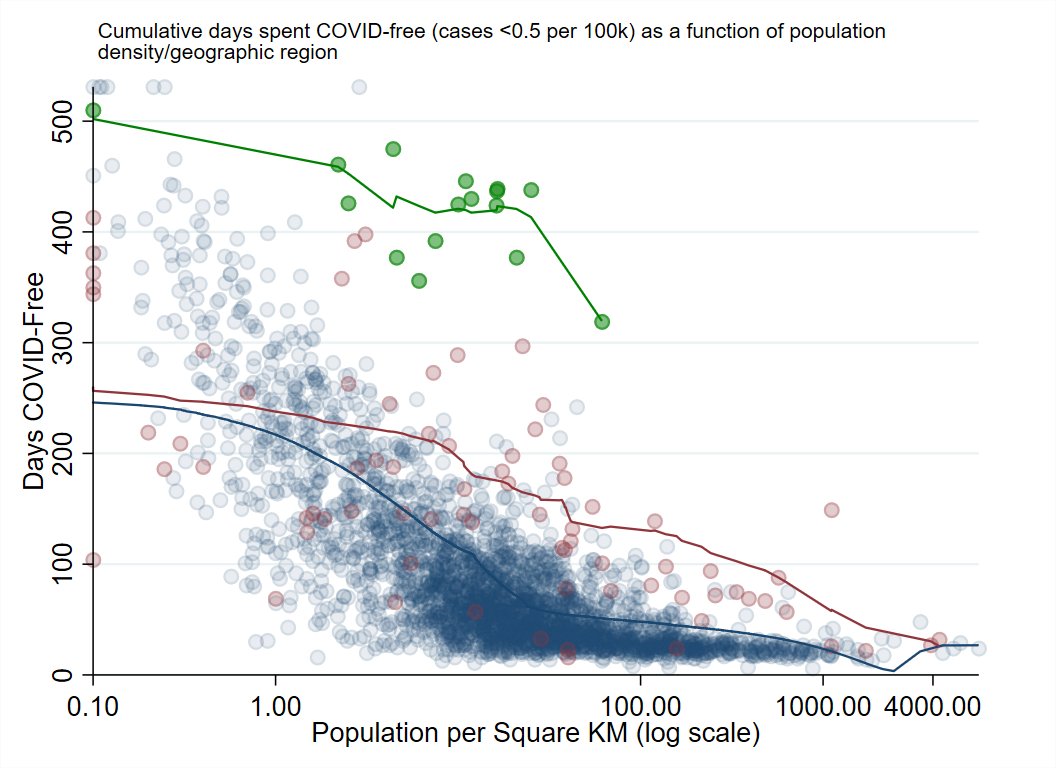
For the first part of the analysis, I'm just going to look at the cumulative outcomes (cases, deaths, days spent COVID-free, days spend in a major outbreak) for Canadian health regions (red for most of the country, green for Atlantic) and US counties (blue)
I used cases per capita running average < 0.5 per 100k to define 'covid-free' and a running average of >5 per 100k to define major outbreak state (same as the last times I did this).
Here are the health regions and counties mapped out on those metrics, across population density.
Bad outcomes become more likely in more densely populated areas, but it's a really, really shallow slope in all three groups.
Atlantic success in keeping the virus out stands out.
Bad outcomes become more likely in more densely populated areas, but it's a really, really shallow slope in all three groups.
Atlantic success in keeping the virus out stands out.


And here's what it looks like when you plot each health region/county in terms of deviation from expectations based on population density.
Upper left quadrant would be the "good at pandemics" space. Bottom right the "not good at pandemics" space.
Upper left quadrant would be the "good at pandemics" space. Bottom right the "not good at pandemics" space.

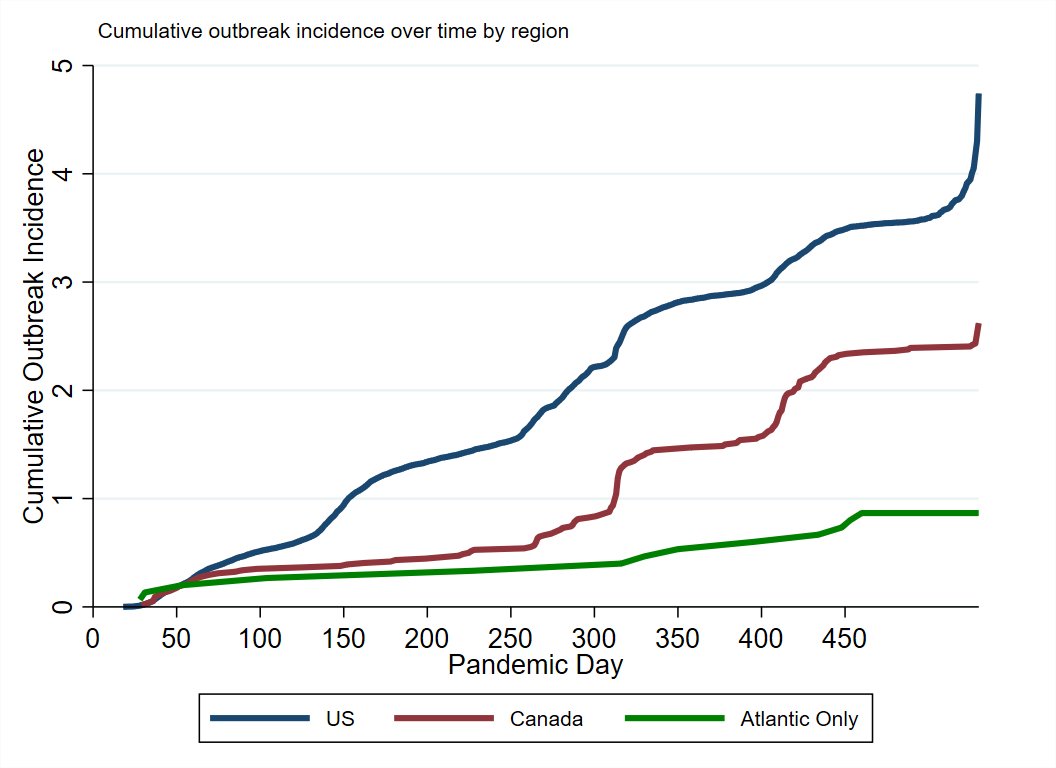
For the 2nd part of the analysis, I used the peak detection program wrote to find when outbreaks maxed out in different places (min peak >5 per 100k)
Here's the timeline for places having their first major outbreak, starting at 01MAR2020.
First is overall (all health regions and counties), second is split by density), third is split by country/region.
First is overall (all health regions and counties), second is split by density), third is split by country/region.


Urban counties/health regions tended to have their first outbreaks sooner, but it's not as stark a gap as most people think.
Obvious large differences by geography. Canadian health regions took longer to have their first outbreaks (although basically all of them eventually did).
Only about half of the Atlantic health regions have ever had a major outbreak to-date.
Only about half of the Atlantic health regions have ever had a major outbreak to-date.
Of course, places can have more than one outbreak over time.
Here's the same plots, just allowing for counties/health regions to repeatedly fail/have outbreaks.
Here's the same plots, just allowing for counties/health regions to repeatedly fail/have outbreaks.

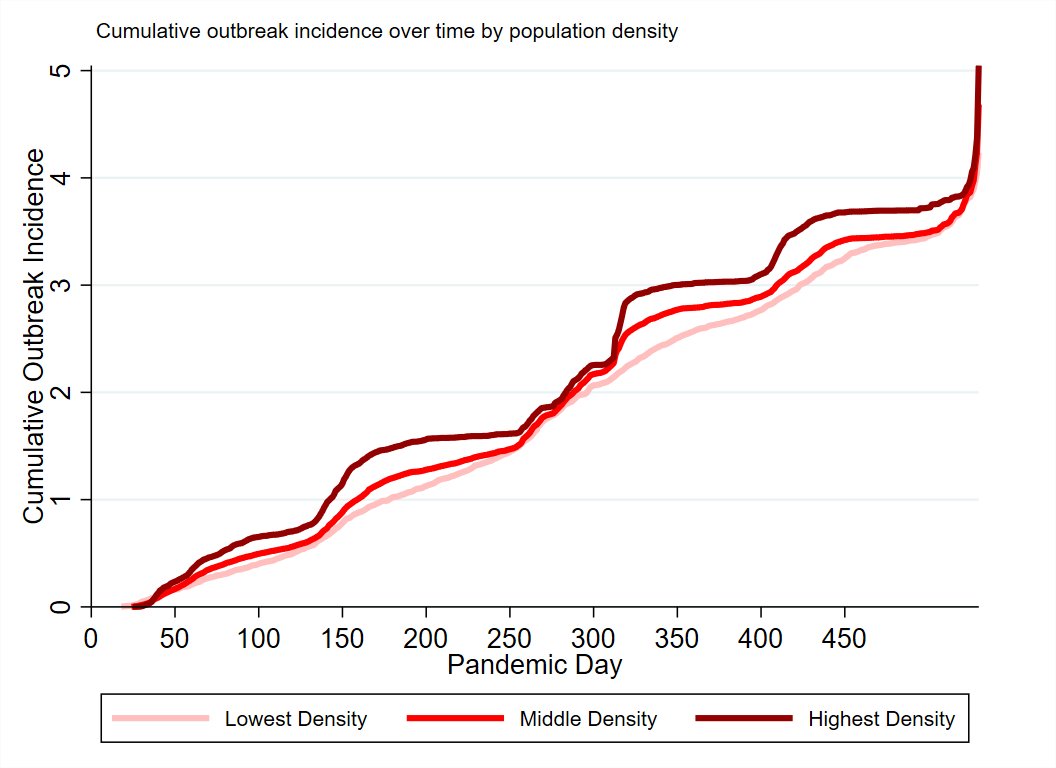

Density matters a bit, but the different locations are staggeringly different.
Adjusting for density, Canadian health regions had a 54% lower odds of outbreak risk. vs US counties.
For Atlantic health regions that risk reduction is 88%.
Adjusting for density, Canadian health regions had a 54% lower odds of outbreak risk. vs US counties.
For Atlantic health regions that risk reduction is 88%.
The last part will look at how different places have done at resolving outbreaks (defined as the time from the peak to whenever the jurisdiction gets to a running average of <2.5 cases per 100k).
Here's the overall timeline for outbreaks to resolve, then paired with graphs showing the timeline by country/region, density, and size of the outbreak (at peak).


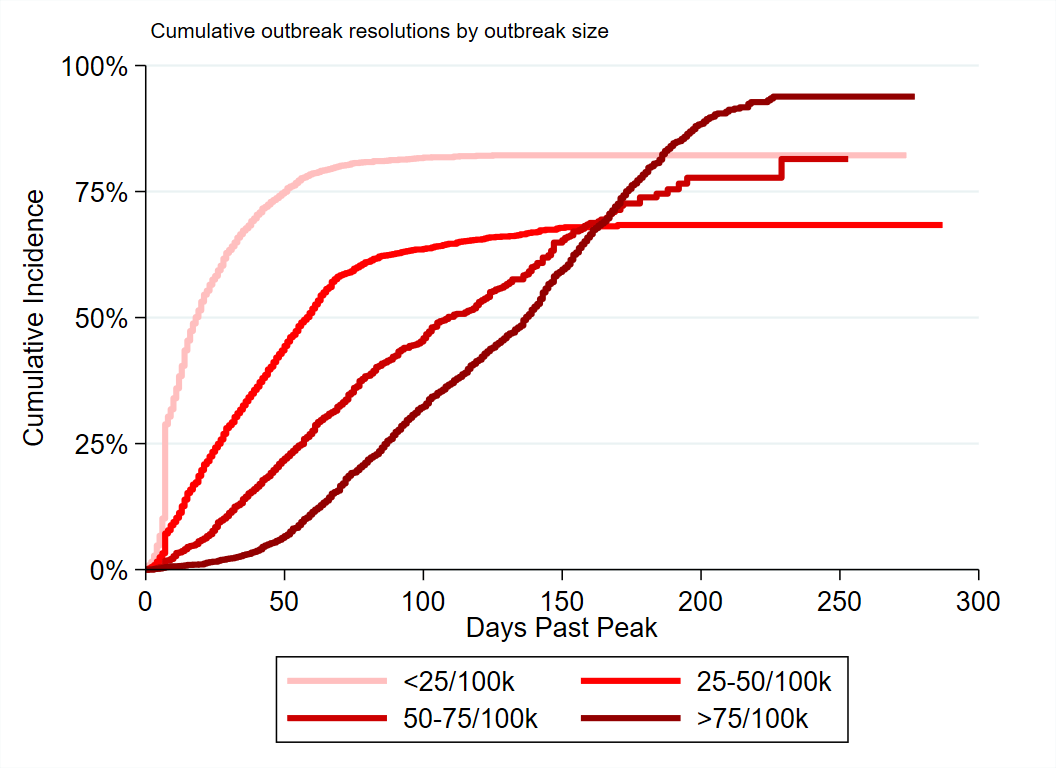
There are large effects for each. More densely populated places and places having a large outbreak take longer to resolve (and are less likely to do so before the next outbreak starts)
Generally speaking, the US counties had larger per capita outbreaks than Canadian regions.
We can try to parse out the differences by adjusting for density/outbreak size, or by limiting the analysis to a band of outbreaks within a certain size.
Mostly same results.
We can try to parse out the differences by adjusting for density/outbreak size, or by limiting the analysis to a band of outbreaks within a certain size.
Mostly same results.


Probably the biggest differences between the models not adjsuting for these factors (1) and those that do (2 and 3) is that the non-Atlantic Canadian health regions and US counties have similar success at resolving outbreaks when you try to adjust for these factors.


The quick notes version is that Canadian health regions have been less likely to have outbreaks and tend to have smaller outbreaks but not necessarily be any better at resolving when they do occur.
Atlantic Canada beats everyone on all metrics because of course.
Atlantic Canada beats everyone on all metrics because of course.
That's it for this (delayed) monthly update!
Back on later for the Atlantic numbers.
Back on later for the Atlantic numbers.
• • •
Missing some Tweet in this thread? You can try to
force a refresh