Who's ready for a 69-tweet Tesla forecast thread?
This slide is an overview of my latest revision
The next 16 tweets in the thread are updated charts
The next 3 slides are executive summary tables
The final 49 tweets show my detailed forecast assumptions
🤓 $TSLA
/1
This slide is an overview of my latest revision
The next 16 tweets in the thread are updated charts
The next 3 slides are executive summary tables
The final 49 tweets show my detailed forecast assumptions
🤓 $TSLA
/1

Here's how Tesla's revenue has grown over the years.
These are *actuals*, not my forecast.
2021 is looking very good.
/2
These are *actuals*, not my forecast.
2021 is looking very good.
/2

Here's a S3XY chart showing global vehicle deliveries by model and quarter.
I am projecting just over 850K deliveries for the full year 2021, which would make 70% year-over-year growth. 👀
/3
I am projecting just over 850K deliveries for the full year 2021, which would make 70% year-over-year growth. 👀
/3

Here's a chart showing deliveries for Tesla's 2 best-selling models (2 of 2020's Top 3 premium vehicles sold in the U.S.): Model 3 and Model Y.
I'm looking forward to seeing how quickly Tesla can ramp Model Y in China.
/4
I'm looking forward to seeing how quickly Tesla can ramp Model Y in China.
/4

Here's a chart showing the relationship between Production and Delivery numbers over time, including my forecast through 2023.
Growth over the next 2 years will come mostly from opening 2 enormous new final assembly plants:
Giga Berlin & Giga Austin
/5
Growth over the next 2 years will come mostly from opening 2 enormous new final assembly plants:
Giga Berlin & Giga Austin
/5

Here's a chart showing Tesla's Adjusted EBITDA over time.
This profitability metric is cleaner than GAAP Earnings or Non-GAAP Earnings because it excludes non-cash stock compensation and things beyond management control, such as depreciation on existing assets and taxation.
/6
This profitability metric is cleaner than GAAP Earnings or Non-GAAP Earnings because it excludes non-cash stock compensation and things beyond management control, such as depreciation on existing assets and taxation.
/6

Here are a few charts all the Tesla haters hate.
They like to pretend that Tesla still loses money.
But facts are stubborn things and no matter which way you look at it, Tesla makes money now.
/7
They like to pretend that Tesla still loses money.
But facts are stubborn things and no matter which way you look at it, Tesla makes money now.
/7

Here's a revenue chart I keep updated for @TESLAcharts because he stopped updating and tweeting it after Q2 2020.
I wonder why?? 🤔
(gray bars are actuals, red bars are my forecast)
/8
I wonder why?? 🤔
(gray bars are actuals, red bars are my forecast)
/8

For many years now, the Tesla haters have complained "bUt yOu hAVe to BaCk oUt the 1-TiMe rEguLatOrY cReDiTs!!"
They keep using the term "1-time".
Not sure they know what 1-time means...
(gray bars are actuals, red bars are my forecast)
/9
They keep using the term "1-time".
Not sure they know what 1-time means...
(gray bars are actuals, red bars are my forecast)
/9

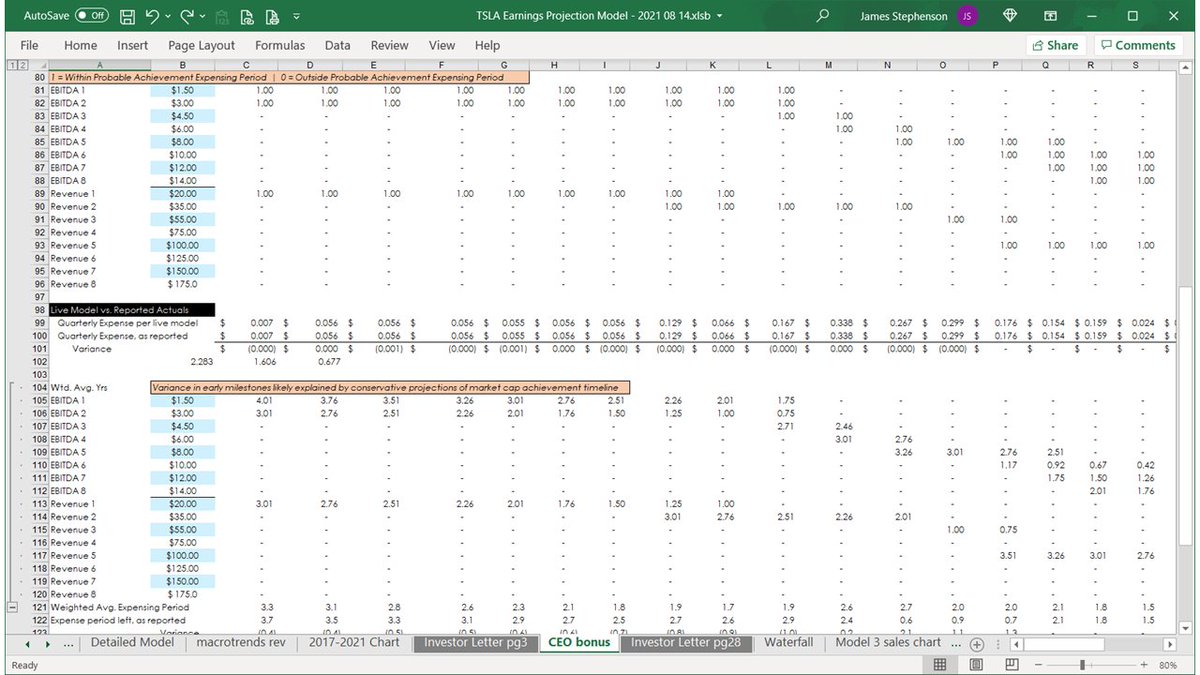
Here's a chart showing stock-based compensation expense related to the 2018 CEO Performance Award.
This is a non-cash expense excluded from Adjusted EBITDA and Non-GAAP Earnings.
It will not exceed $2.283B ($1.784B of which has already hit) over the plan's 10-year life.
/10
This is a non-cash expense excluded from Adjusted EBITDA and Non-GAAP Earnings.
It will not exceed $2.283B ($1.784B of which has already hit) over the plan's 10-year life.
/10

Here's a chart showing where the average dollar of Tesla revenue comes from, over time, using a 12-month trailing average to smooth out seasonality.
/11
/11

Similarly, this chart shows how Tesla spends every dollar of revenue, on average.
📉 When Tesla spent *more than* the total revenue, there was a Non-GAAP *loss*.
📈 When Tesla spent *less than* the total revenue, there were Non-GAAP *profits*.
/12
📉 When Tesla spent *more than* the total revenue, there was a Non-GAAP *loss*.
📈 When Tesla spent *less than* the total revenue, there were Non-GAAP *profits*.
/12

Here's a chart showing quarterly:
Beginning Inventory (Finished Goods vehicles)
Production
Deliveries, and
Ending Inventory
One month's ending inventory is the next month's beginning inventory.
You cannot deliver more vehicles than Beginning Inventory + Production.
/13
Beginning Inventory (Finished Goods vehicles)
Production
Deliveries, and
Ending Inventory
One month's ending inventory is the next month's beginning inventory.
You cannot deliver more vehicles than Beginning Inventory + Production.
/13

Here's a stacked area chart showing quarterly deliveries by site and model.
Even with 2021 deliveries likely to exceed 2020 by >50%, we're likely to see >50% growth again in 2022, if the ramps of Giga Berlin and Giga Austin go smoothly. 🤞
/14
Even with 2021 deliveries likely to exceed 2020 by >50%, we're likely to see >50% growth again in 2022, if the ramps of Giga Berlin and Giga Austin go smoothly. 🤞
/14

This chart shows Tesla's Non-GAAP Earnings per delivery, smoothed using a 12-trailing month average.
I placed a dashed box around the 4 quarters when I'm forecasting earnings favorability from declaring tax benefits from prior year losses.
Timing on that is very uncertain.
/15
I placed a dashed box around the 4 quarters when I'm forecasting earnings favorability from declaring tax benefits from prior year losses.
Timing on that is very uncertain.
/15

"Now subtract regulatory credits!", the haters will say.
Fine. Here's what it looks like if you subtract Reg. Credits from earnings.
That's a totally bogus calculation (not tax-effected) on a meaningless adjustment (it is not valid to subtract revenue from earnings) btw.
/16
Fine. Here's what it looks like if you subtract Reg. Credits from earnings.
That's a totally bogus calculation (not tax-effected) on a meaningless adjustment (it is not valid to subtract revenue from earnings) btw.
/16

Here's a chart illustrating a point Zach made on the most recent earnings call:
Tesla has been *improving gross margin %* even while *average selling price has been falling* (because sales mix shifted to more affordable 3s & Ys).
Giga Shanghai made today's margins possible.
/17
Tesla has been *improving gross margin %* even while *average selling price has been falling* (because sales mix shifted to more affordable 3s & Ys).
Giga Shanghai made today's margins possible.
/17

That's all of the charts for today's 🧵.
The next 3 tweets summarize my forecast as tables of numbers some of my fellow 🤓🤓🤓 may prefer.
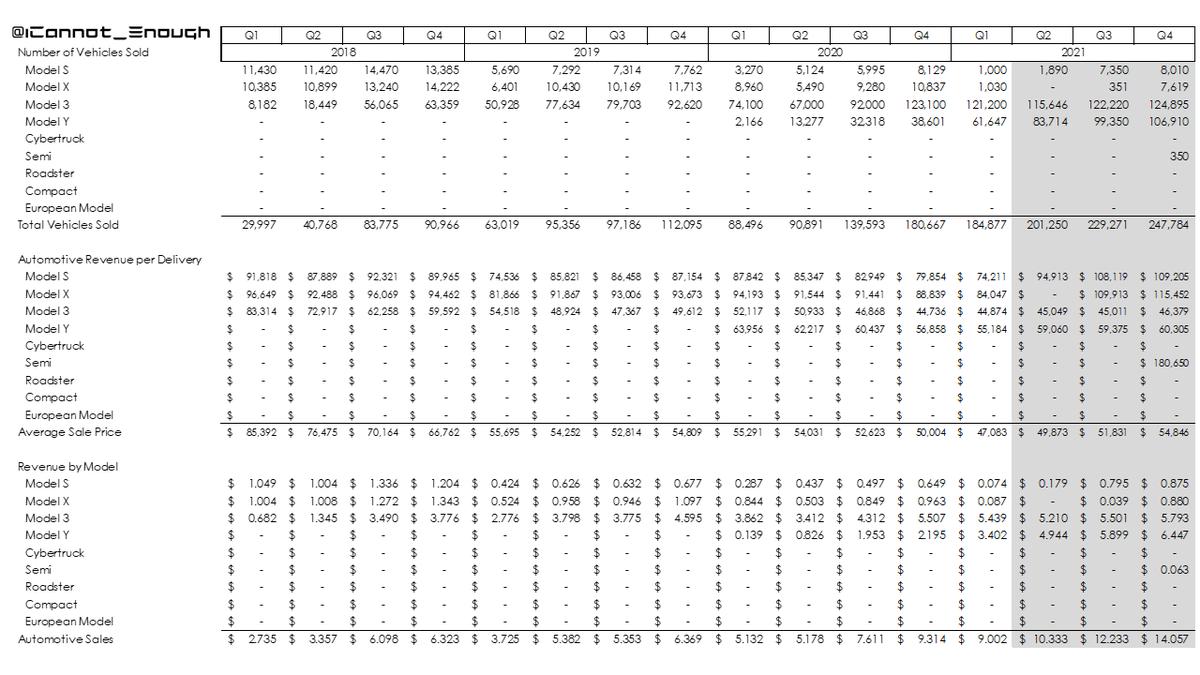
This one shows global unit sales, revenue per delivery, and revenue dollars, by model, by quarter.
/18
The next 3 tweets summarize my forecast as tables of numbers some of my fellow 🤓🤓🤓 may prefer.
This one shows global unit sales, revenue per delivery, and revenue dollars, by model, by quarter.
/18

All of my detailed forecasting is ultimately to make this one page:
the Income Statement.
I have to forecast that Tesla will take the benefit from prior year losses against its tax expense at some point, so I put 80% of the ($2B) in Q4 2021 and the other 20% in Q1 2021.
/19
the Income Statement.
I have to forecast that Tesla will take the benefit from prior year losses against its tax expense at some point, so I put 80% of the ($2B) in Q4 2021 and the other 20% in Q1 2021.
/19

This page shows:
share count
EPS (mind the GAAP)
Cost of Sales % detail by division
Deliveries by site, model, and quarter
See tweet #1 of this thread for my Non-GAAP EPS (diluted) forecast of $1.45 in Q3.
/20
share count
EPS (mind the GAAP)
Cost of Sales % detail by division
Deliveries by site, model, and quarter
See tweet #1 of this thread for my Non-GAAP EPS (diluted) forecast of $1.45 in Q3.
/20

The rest of this 🧵 shows my detailed Excel model that builds up from forecast assumptions to all of the charts and tables you've seen previously.
I only tweet this out once per quarter, in case people find it helpful.
The first section forecasts Production & Deliveries.
/21
I only tweet this out once per quarter, in case people find it helpful.
The first section forecasts Production & Deliveries.
/21

I think it's helpful to approach my forecast in a way that forces me to revisit every granular assumption, so that things like weeks of production by site and model, price changes, mix, etc., get weighted correctly.
It would be easy to miss those doing a high-level forecast.
/22
It would be easy to miss those doing a high-level forecast.
/22

/23

/24

Here's where I total up the production, deliveries (to cash buyers vs. subject to lease accounting), beginning and ending inventory levels, and calculate days of sales in ending inventory.
/25
/25

These are the subtotals by site.
/26
/26

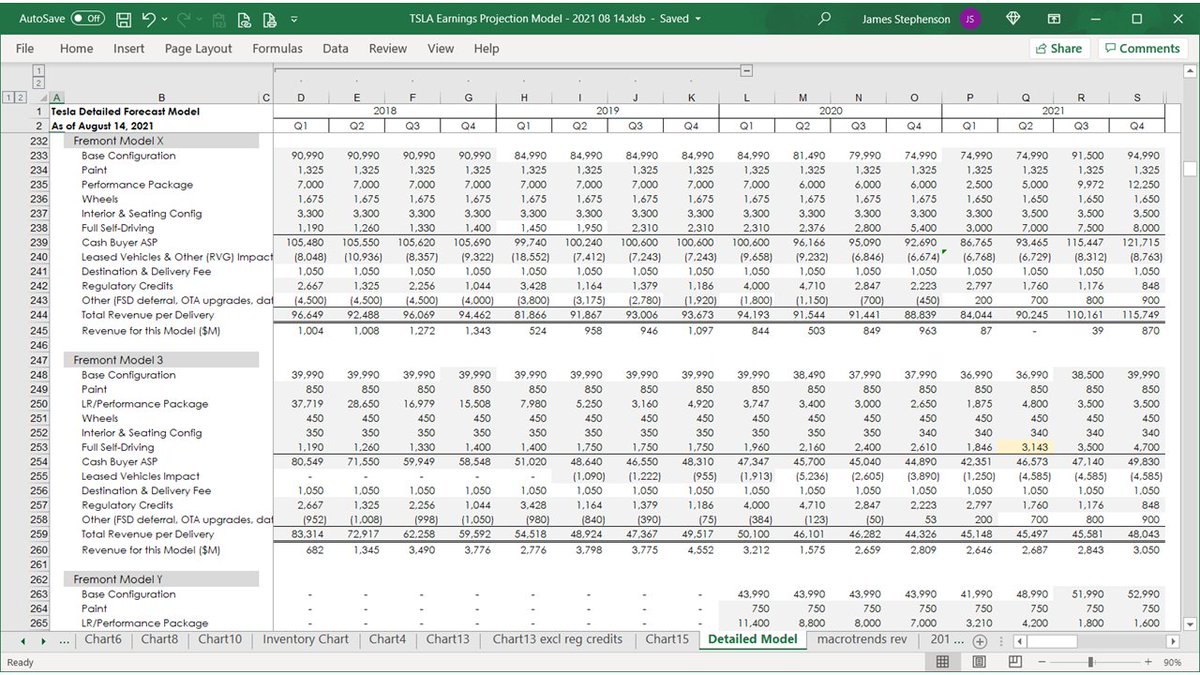
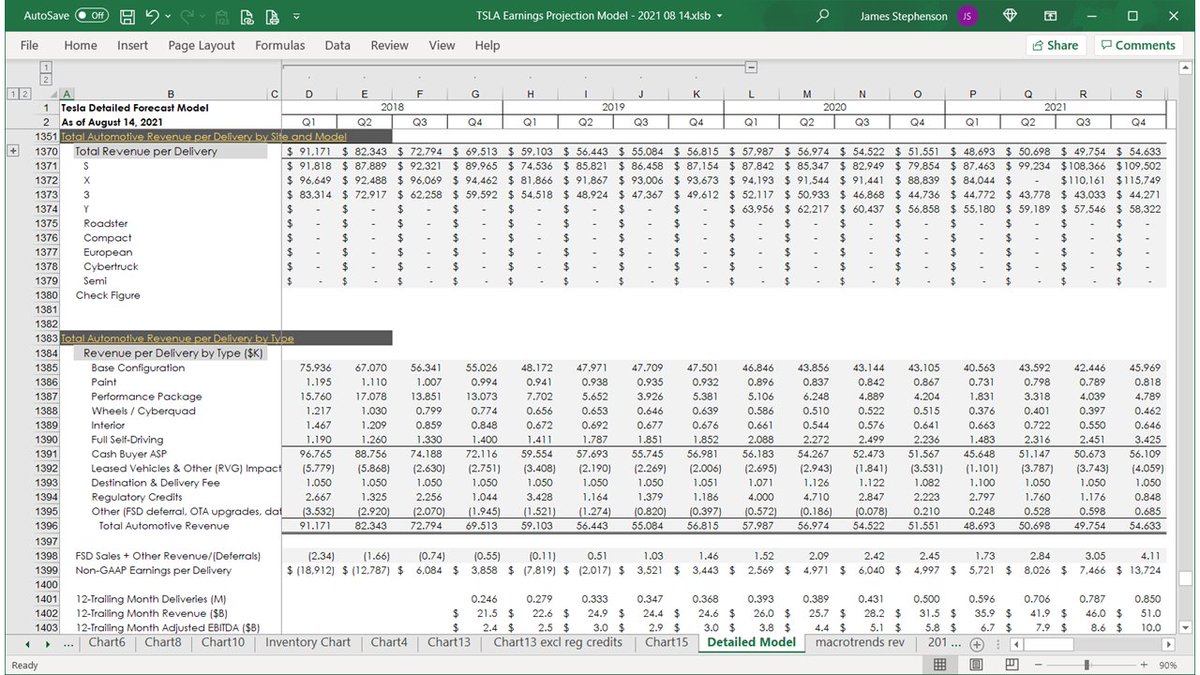
The next section of the detailed buildup forecasts Automotive Revenue per vehicle by model, by site, by quarter, from base price to total Automotive revenue per vehicle by making assumptions about option take rates, pricing, FSD, Leasing, etc.
/27
/27

/28
/29

/30

/31

/32

/33

Here are the ASP subtotals by site:
/34
/34

You're halfway to the end of the 🧵!
/35
/35

/36

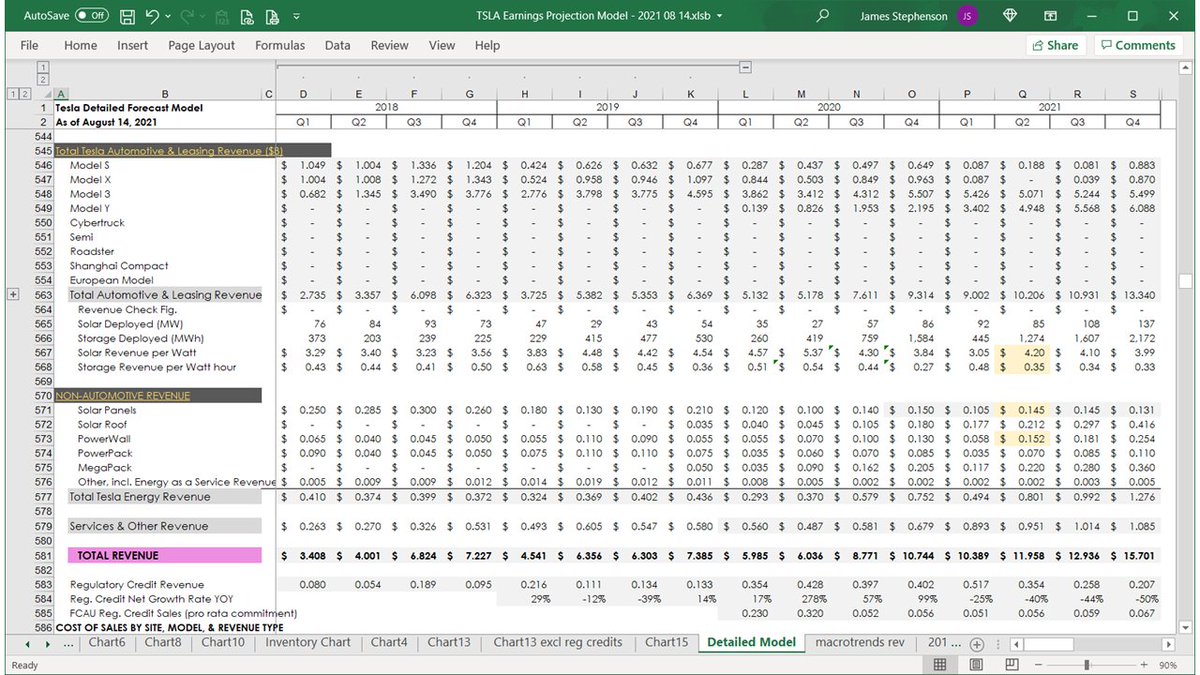
Here are the global total ASPs for all models, for cash buyers vs. Leased vehicles, with combined totals at the bottom.
/37
/37

Here's the Tesla Energy division revenue forecast by product, with metrics.
/38
/38
The end of the revenue section begins the Automotive Cost of Sales section, in the same format and at the same level of detail as the revenue section.
/39
/39

/40

/41

/42

/43

/44

/45

Here are the total global Automotive Cost of Sales dollars by model:
/46
/46

Here is the Cost of Sales forecast for the Tesla Energy division and Services & Other.
The fourth section just shows the Cost of Sales %'s you get when you divide the detailed costs in the third section by the detailed revenues in the second section.
/47
The fourth section just shows the Cost of Sales %'s you get when you divide the detailed costs in the third section by the detailed revenues in the second section.
/47

/48

/49

/50

/51

/52

/53

Here are the total Cost of Sales %'s by model:
/54
/54

Here's the summary page for Total Automotive Cost of Sales % by Model:
/55
/55

Here are the COS %'s for the Tesla Energy division and Services & Other, which ends the detail section and begins the fifth section:
Income Statement summary.
/56
Income Statement summary.
/56

All of the granular detail above was used to get the best possible forecasts for the dollars shown here above the Gross Margin line.
This format matches how Tesla reports it, so the bottom-line number shown on this page is GAAP Earnings.
/57
This format matches how Tesla reports it, so the bottom-line number shown on this page is GAAP Earnings.
/57

This page shows:
GAAP to Non-GAAP Net Income reconciliation
Share count
Earnings per share metrics
Share price
Market cap
CEO bonus milestone metrics
Stock based compensation detail
... and several other items that may be of interest to you
/58
GAAP to Non-GAAP Net Income reconciliation
Share count
Earnings per share metrics
Share price
Market cap
CEO bonus milestone metrics
Stock based compensation detail
... and several other items that may be of interest to you
/58

This page shows:
a reconciliation of GAAP Net Income to Adjusted EBITDA
some share price, earnings growth, and valuation metrics
Gross Margin % with and without Regulatory Credits
Total production, delivery, capacity, and inventory metrics
/59
a reconciliation of GAAP Net Income to Adjusted EBITDA
some share price, earnings growth, and valuation metrics
Gross Margin % with and without Regulatory Credits
Total production, delivery, capacity, and inventory metrics
/59

This page shows Automotive revenues and cost totals broken down by option type.
/60
/60

This page shows:
Total Automotive cost of sales % by option type
Total Revenue and COS per Delivery ($)
Revenue per Fully Diluted Share (quarterly and TTM)
Total Deliveries by Site and Model
/61
Total Automotive cost of sales % by option type
Total Revenue and COS per Delivery ($)
Revenue per Fully Diluted Share (quarterly and TTM)
Total Deliveries by Site and Model
/61

Here's a more complete look at the breakdown of deliveries by site and model partially shown on the previous page, with combined totals (for vehicles produced at multiple sites such as Model 3 and Model Y).
/62
/62

Here's:
Revenue per delivery (by model and by option type)
FSD Sales net of deferred revenue, per delivery
Non-GAAP Earnings, per Delivery
TTM Deliveries, Revenue, and Adj. EBITDA
/63
Revenue per delivery (by model and by option type)
FSD Sales net of deferred revenue, per delivery
Non-GAAP Earnings, per Delivery
TTM Deliveries, Revenue, and Adj. EBITDA
/63
This slide shows:
TTM Non-GAAP Earnings per Delivery
That number minus Reg. Credits revenue per delivery, for my chart 😂🤣
The dollar amounts and calculations for the 100% stacked "same-size statement" charts on how Tesla makes and spends $1 (charts on tweets 11 & 12)
/64
TTM Non-GAAP Earnings per Delivery
That number minus Reg. Credits revenue per delivery, for my chart 😂🤣
The dollar amounts and calculations for the 100% stacked "same-size statement" charts on how Tesla makes and spends $1 (charts on tweets 11 & 12)
/64

These are the 12-trailing month calculations that smooth out the seasonality from the tables above.
/65
/65

Here's the last page from my detailed model, showing a reconciliation of what I call Non-GAAP "Operating Expenses" (see tweet 1 of this thread) to GAAP Operating Expenses.
When you want to compress a whole income statement down to only 4 lines, you have to combine a lot.
/66
When you want to compress a whole income statement down to only 4 lines, you have to combine a lot.
/66

The last 3 tweets are my calculations for estimating Elon's bonus plan expense.
/67
/67

/68

Congratulations! You made it! 🎉🥂🥳
/69 end 🧵
/69 end 🧵
• • •
Missing some Tweet in this thread? You can try to
force a refresh