Travelling Tabby Profile picture
Aug 18, 2021 5 tweets 6 min read Read on X
travellingtabby.com/uk-coronavirus…

The UK is now averaging over 30,000 new cases a day again, after dropping down to as low as 26,000 new cases a day a few weeks ago.

#Covid19UK #coronavirusuk #DailyCovidUpdate
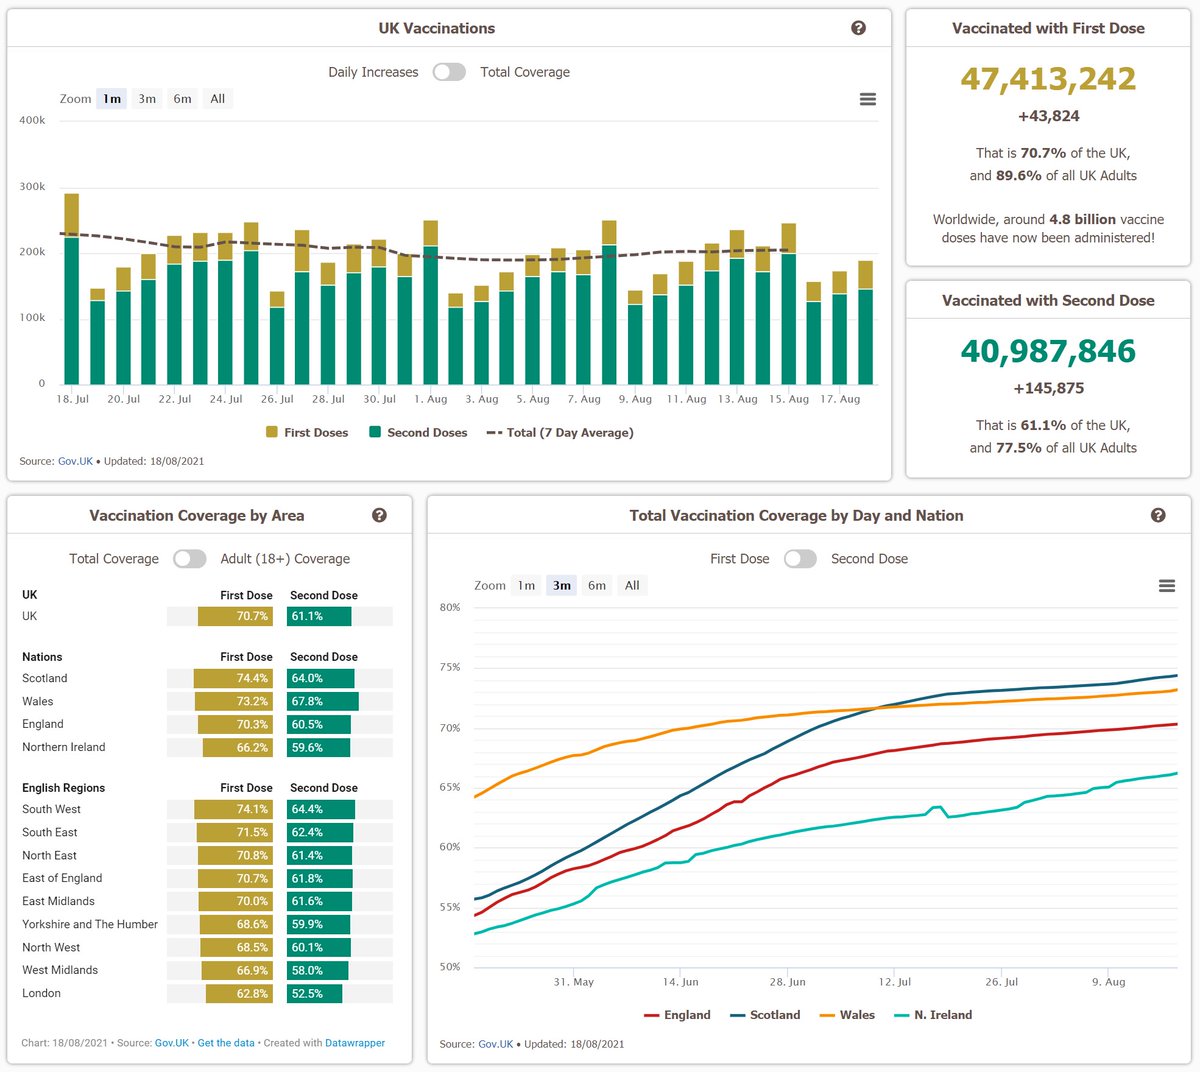
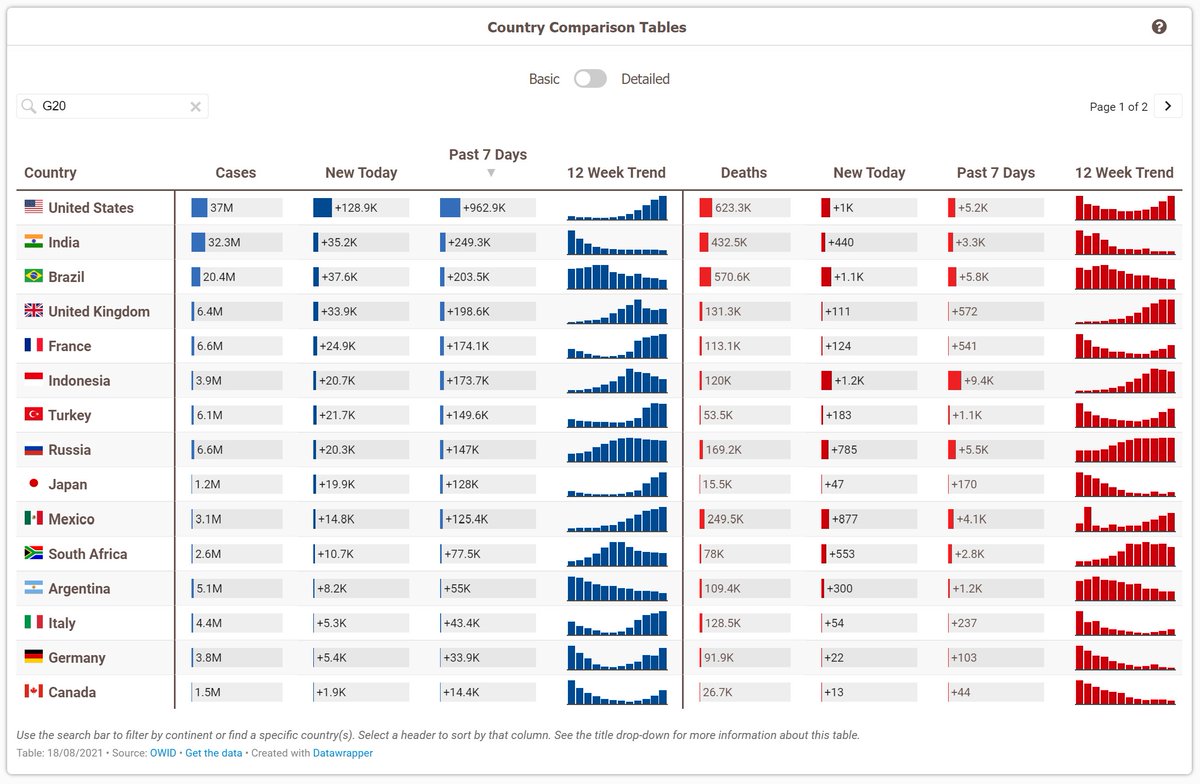
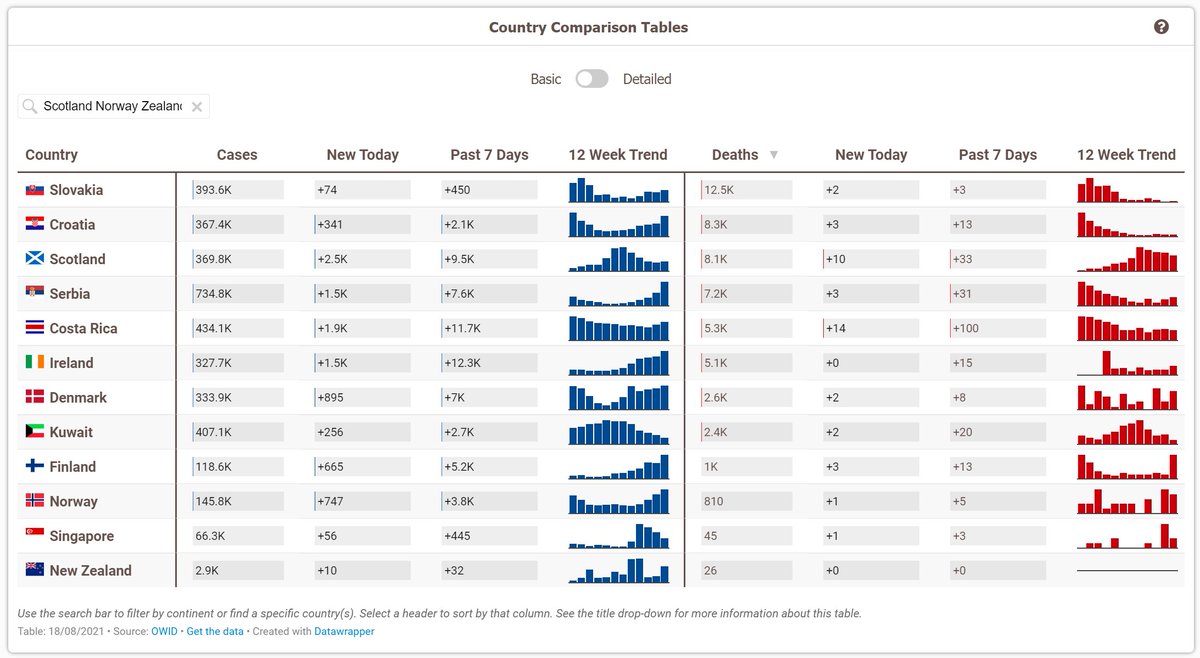
Also in terms of changes, the two country comparison tables on the UK page have been updated now!

On the basic table there is now a 12 week trend of cases/deaths for each country, which will be updated once a week on Sunday.
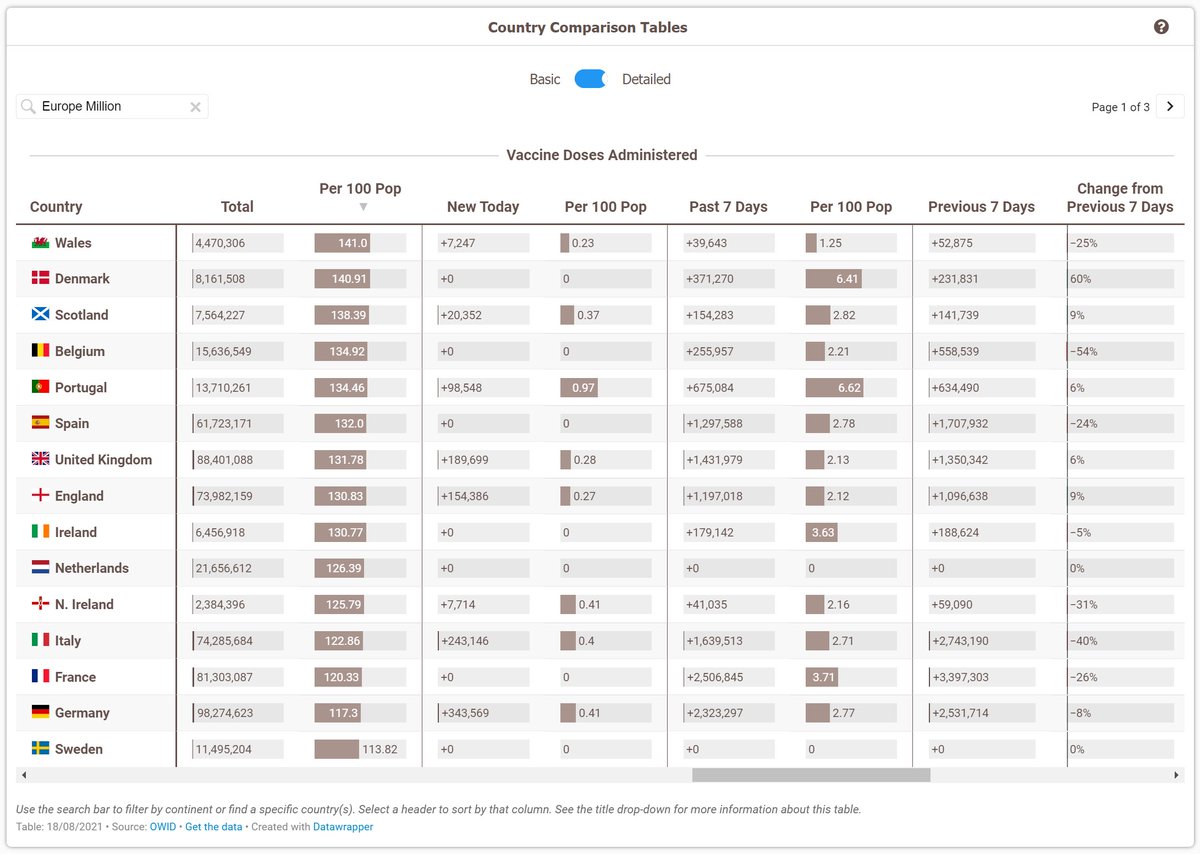
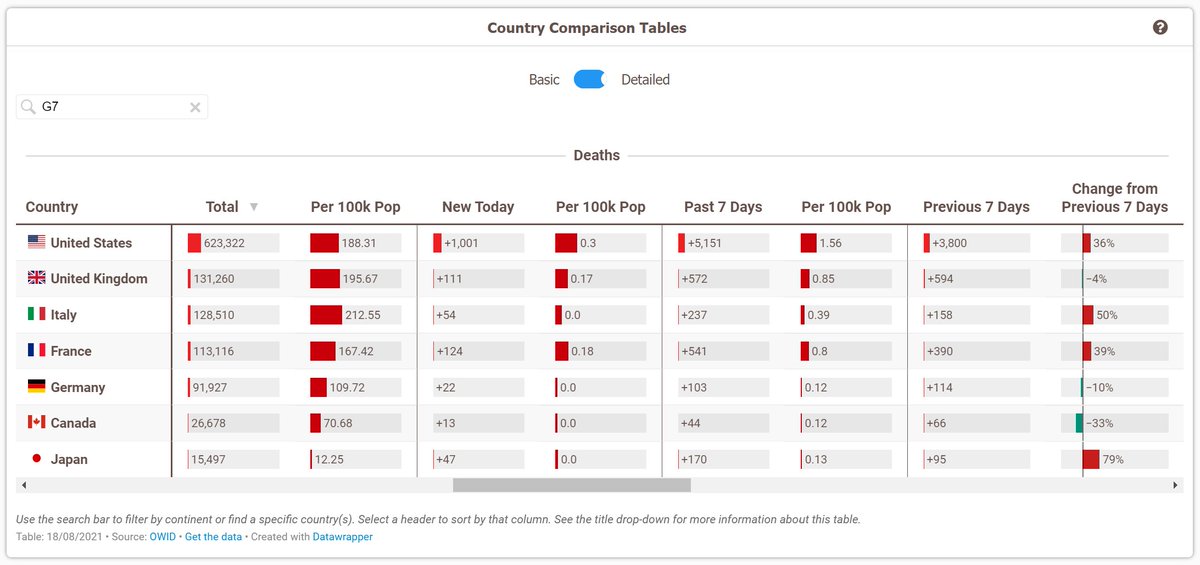
Then on the detailed table there has been a more drastic design change, and the sections for cases, deaths, and vaccinations have all been adjusted to look roughly the same as one another

There is also a 'new today' and a 'change from previous 7 days' column for vaccinations now
And the search bar is a little more useful now!

In addition to typing in 'million' to show countries with over a million population only, you can now type in something like 'Europe million' to show countries with over a million population in Europe specifically.
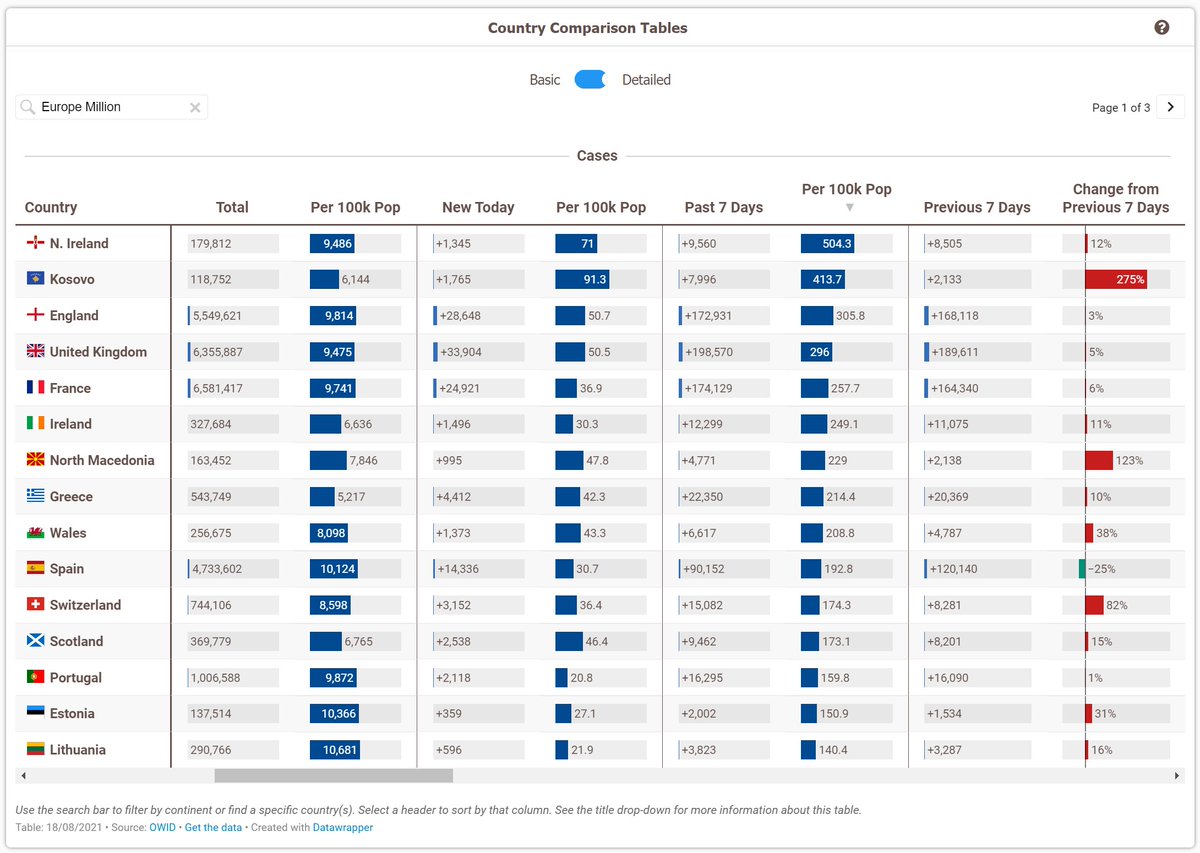
You can also search for 'European Union', 'G7', and 'G20' to just show countries from those groups. And as before you can still just type multiple countries into the search bar to show the figures for them only.

It can be a little finicky at times, but can also be very useful!

• • •

Missing some Tweet in this thread? You can try to force a refresh
 

Keep Current with Travelling Tabby

Travelling Tabby Profile picture

Stay in touch and get notified when new unrolls are available from this author!

Read all threads

This Thread may be Removed Anytime!

PDF

Twitter may remove this content at anytime! Save it as PDF for later use!

Try unrolling a thread yourself!

how to unroll video
  1. Follow @ThreadReaderApp to mention us!

  2. From a Twitter thread mention us with a keyword "unroll"
@threadreaderapp unroll

Practice here first or read more on our help page!

More from @TravellingTabby

Sep 9, 2023
Stop 8: Northern Namibia! 🇳🇦🦏

Leaving Botswana we headed into Namibia and spent a few days driving towards Etosha National Park!

It was great to see different parts of this beautiful country, and also see some animals we’ve not seen anywhere else! Image
During the journey we stopped at Windhoek and Waterberg Plateau, which were both really nice spots with some great hiking trails!

One of our camps had Pumbas running around causing havoc 😅


Image
Image
Image
Image
Once we reached Etosha we did a full day safari drive, which was exhausting, although worth it as we got to see another Leopard, Cheetahs, and a whole bunch more.


Image
Image
Image
Image
Read 6 tweets
Jul 16, 2023
Hallo!

Have been having a break from Twitter, but I'm back now and wanted to share some pictures from a trip I took around Norway recently! 🇳🇴


Image
Image
Image
Image
It was a cruise from Southampton, up to the North Cape and back over the course of about two weeks.

The first stop was Haugesund. The weather was perfect, and it almost felt like I was out in the Inner Hebrides!


Image
Image
Image
Image
Next up was Olden. It was just the second stop, but it was definitely the highlight of the trip! 🏔️

The whole area is stunning. I went up the Loen Skylift (one of the steepest in the world), and got to spend time watching people jumping off cliffs and gliding down the Fjords!


Image
Image
Image
Image
Read 14 tweets
May 18, 2023
After three years, and 800 updates, today marks the final time I'll be updating the Scotland Coronavirus Tracker.

Thank you so much to everyone for all of the support and encouragement over that time. Being able to run this page for so long has been the honour of my life 🥹
The data, of course, will still be released.

The 'Weekly national respiratory infection and COVID-19 statistical report' from PHS includes most of the data for Scotland on it.

On the page below you can view the figures in a report, or on a dashboard.

publichealthscotland.scot/publications/w…
It is released each Thursday. I like the report as it gives a nice clear overview of the situation!

To dive further into the data, the dashboard is nice too. And to see more death figures, you'll want to visit the NRS page below (also each Thursday).

nrscotland.gov.uk/statistics-and…
Read 18 tweets
May 18, 2023
travellingtabby.com/uk-coronavirus…

This week, the UK has reported:

🔵 8,858 new cases (down 20%)
🔴 367 new deaths (down 31%)
🟡 4,201 hospital inpatients (down 14%)
🟠 95 ICU/Ventilation inpatients (down 10%)

#Covid19UK #coronavirusuk ImageImageImageImage
Here are some additional case figures!

Reported case rates are still mostly falling throughout the UK, and across the planet as a whole. Although of course, a large part of that is due to a reduction in testing. ImageImageImageImage
The hospital figures are falling across the UK too!

Here are some of the hospital admission figures for England. It has been a lot of up and down over 2022/2023, but the rates right now are some of the lowest they've been throughout that period. Image
Read 4 tweets
May 18, 2023
travellingtabby.com/scotland-coron…

This week, Scotland has reported:

🔵 606 new cases (down 27%)
🔴 30 new deaths (down 33%)
🟡 207 hospital inpatients (down 26%)
🟠 2 ICU inpatients

#covid19scotland #coronavirusscotland ImageImageImageImage
So another drop in reported cases!

We're actually averaging under 100 new cases a day now, for the first time since August 2020! Although of course that is largely a result of low testing levels. ImageImageImageImage
The latest wastewater figures show that the levels there are still low (the lowest in nearly two years), although it does look like there has been a slight increase during the first week of May.

publichealthscotland.scot/media/19559/we… ImageImage
Read 9 tweets
Mar 24, 2023
From the Coronavirus Infection Survey, the estimated number of people in each nation who had Covid-19 during the latest week was:

🏴󠁧󠁢󠁥󠁮󠁧󠁿 England: 1 in 40
🏴󠁧󠁢󠁳󠁣󠁴󠁿 Scotland: 1 in 40
🏴󠁧󠁢󠁷󠁬󠁳󠁿 Wales: 1 in 40
🍀 Northern Ireland: 1 in 70

travellingtabby.com/coronavirus-in…
There was no update for Northern Ireland this week (although their figures for last week were adjusted a little).

So the figures shown on the page for Northern Ireland are still just for last week, and their trends don't go as far along as the rest of the UK.
And due to a lower number of samples, the figures for this week also have a higher degree of uncertainty to them than normal.

But from what is available, there were increases in England (particularly the North West / East Midlands / South East), Scotland, and Wales.
Read 6 tweets

Did Thread Reader help you today?

Support us! We are indie developers!


This site is made by just two indie developers on a laptop doing marketing, support and development! Read more about the story.

Become a Premium Member ($3/month or $30/year) and get exclusive features!

Become Premium

Don't want to be a Premium member but still want to support us?

Make a small donation by buying us coffee ($5) or help with server cost ($10)

Donate via Paypal

Or Donate anonymously using crypto!

Ethereum

0xfe58350B80634f60Fa6Dc149a72b4DFbc17D341E copy

Bitcoin

3ATGMxNzCUFzxpMCHL5sWSt4DVtS8UqXpi copy

Thank you for your support!

Follow Us!

:(