1/11 🇸🇪 update of three charts including June and July with all cause mortality.
Additionally gathering some of my previous graphs in 🧵👇🏽👇🏽👇🏽which I have been meaning to do for some time >>
Additionally gathering some of my previous graphs in 🧵👇🏽👇🏽👇🏽which I have been meaning to do for some time >>

2/11 and… last couple of months have all been below average of 15-19 mortality as provisional 2021 data reveals, 1, 2… 6 consecutive months >>

3/11 and somewhat arbitrarily comparing January through July… it starts to look good so far for 2021 before entering autumn and probably new global calls for lockdowns and whatever >>

4/11 this above sort of what you looked for? @coqumragep279
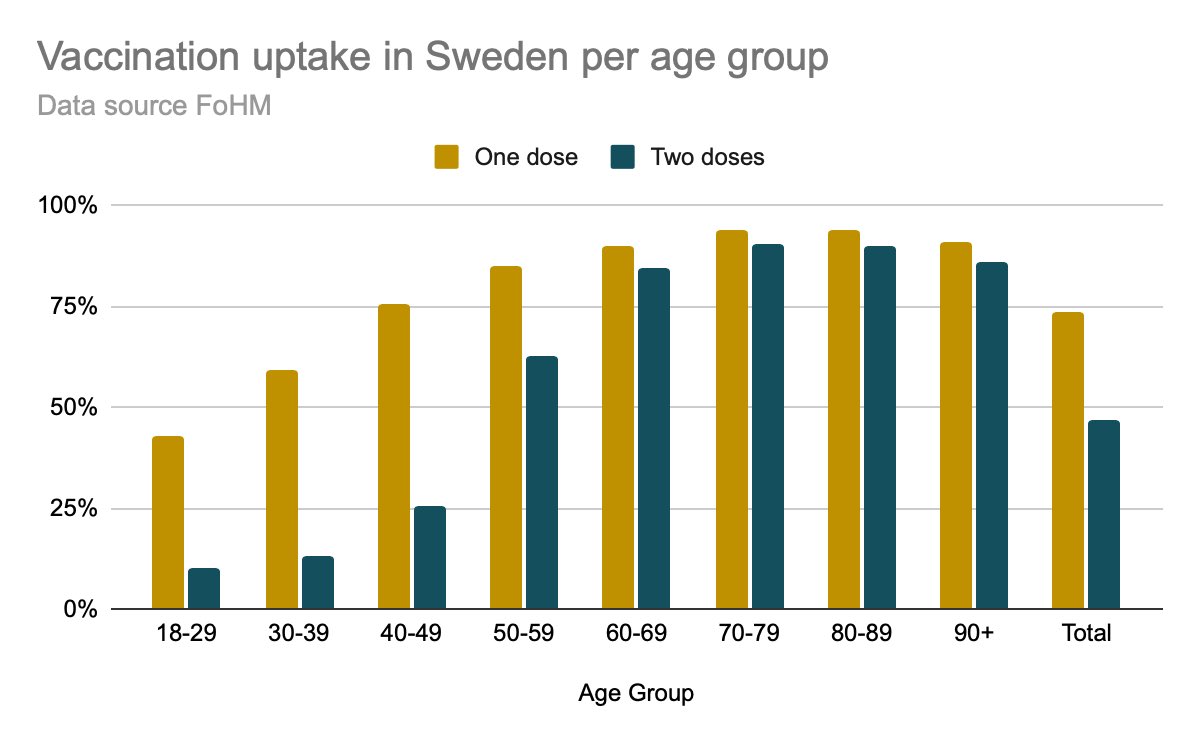
At any rate, below 👇🏽 follows a few of my earlier tweets which I have - as mentioned - been wanting to gather in one 🧵. 1st vaccination progression combined with deaths and ICU >>
At any rate, below 👇🏽 follows a few of my earlier tweets which I have - as mentioned - been wanting to gather in one 🧵. 1st vaccination progression combined with deaths and ICU >>
https://twitter.com/haroldofworld/status/1421062898567237632
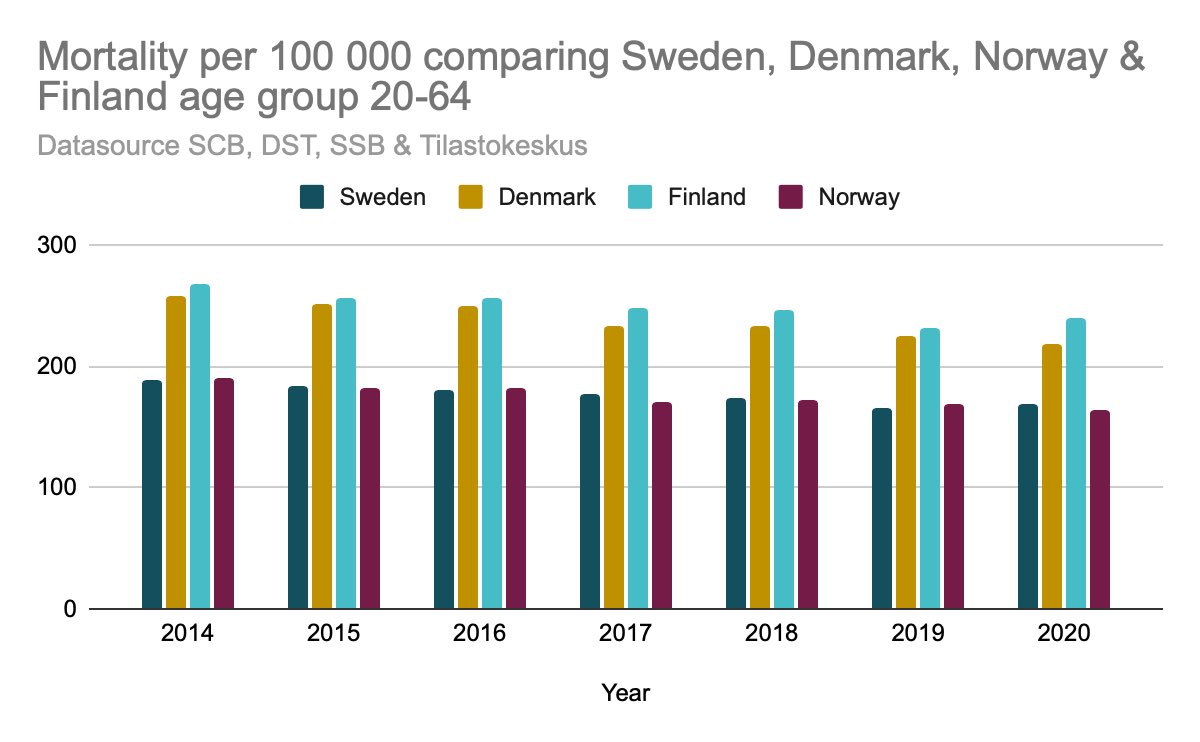
5/11 and 2nd age standardised mortality rates comparing our beloved and friendly nordic countries >>
https://twitter.com/HaroldofWorld/status/1386241441245147139
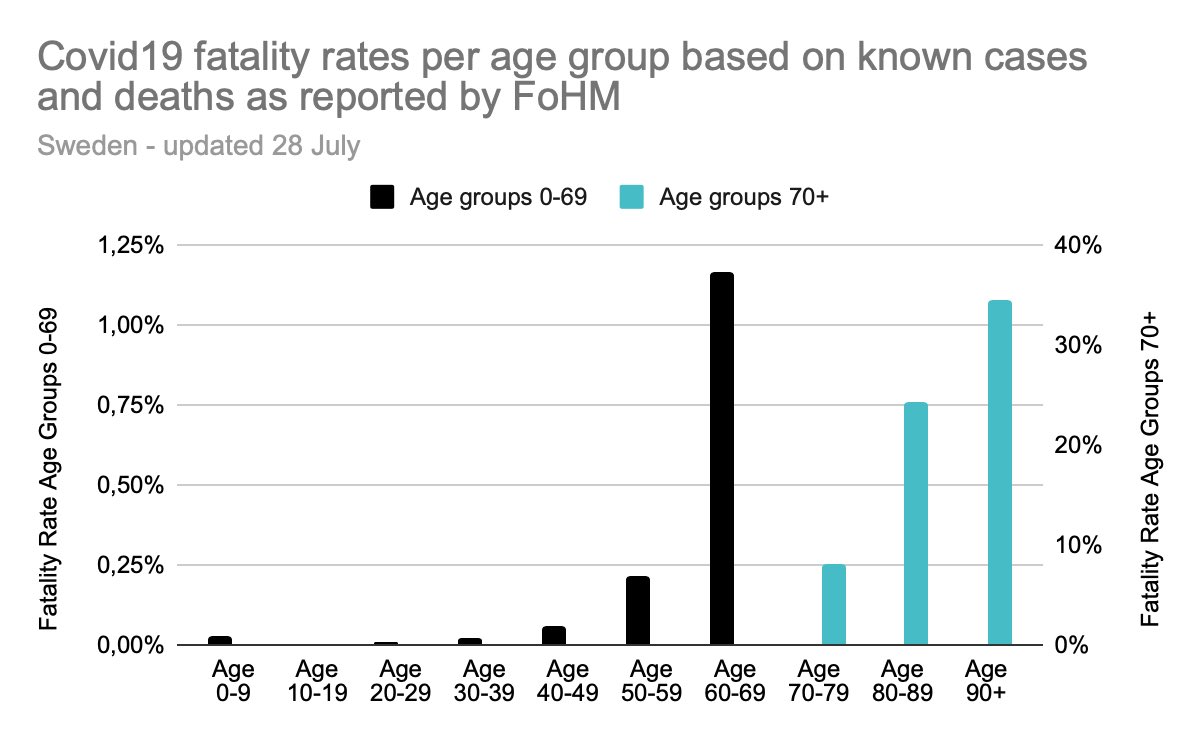
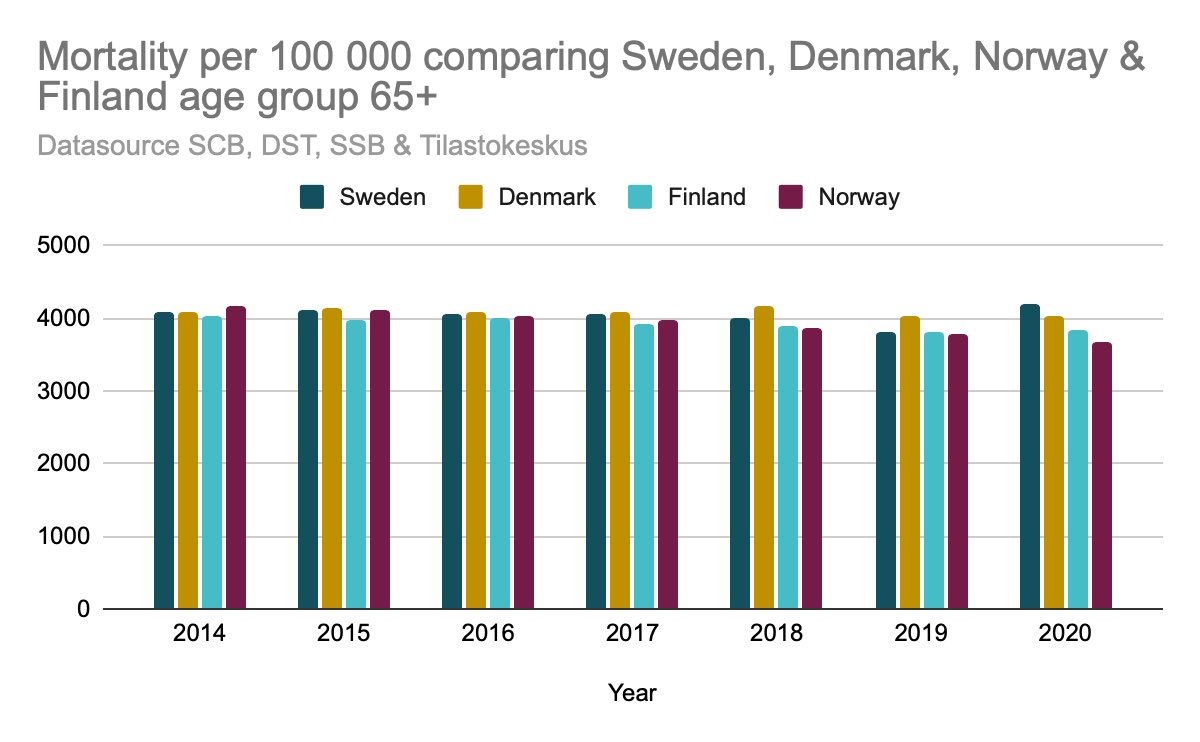
6/11 next tweet is same as above but detailed on three age groups👇🏽 >>
https://twitter.com/HaroldofWorld/status/1386768514799869959
7/11 and here we took a quick look at 2020 provisional cause of death👇🏽👇🏽 it’s weird that people die of other causes as well… I know😐 >>
https://twitter.com/HaroldofWorld/status/1373007329554264064
8/11 largest increase in mortality seen within the elderly care population 👇🏽👇🏽 but please, do enjoy your lockdown >>
https://twitter.com/HaroldofWorld/status/1372161595762163713
9/11 and age groups below 65 experienced a pretty normal year in terms of mortality >>
https://twitter.com/haroldofworld/status/1367215686519578625
10/11 and a little something on hospitalisations where - tbf - one wonders where the preparedness for pandemics went disappearing >>
https://twitter.com/HaroldofWorld/status/1347289807211397123
11/11 perhaps one day that question might be more interesting to ask than who didn’t socially distance themselves well enough🤭 //END
https://twitter.com/HaroldofWorld/status/1346582588002078721
• • •
Missing some Tweet in this thread? You can try to
force a refresh