🚨Thread Alert🚨
Trade Entry & Exit - a Deep Dive
Sick of getting stopped out, taking a shitty entry, or generally feel like you gettin your arse whooped in trading?
If so, you’re in luck my friends - I’ve knocked up this whizz bang, you beaut thread for you:
✍️📒
Trade Entry & Exit - a Deep Dive
Sick of getting stopped out, taking a shitty entry, or generally feel like you gettin your arse whooped in trading?
If so, you’re in luck my friends - I’ve knocked up this whizz bang, you beaut thread for you:
✍️📒
Agenda
- Setting Up Fibonacci (Fibs)
- Long & Short Tool
- Position Size Calc
- How to Use Fibs
- Position Entries Based on Fibs
- Fib Targets
- The Importance of the 0.28 Level & Profit Taking
- Setting Up Fibonacci (Fibs)
- Long & Short Tool
- Position Size Calc
- How to Use Fibs
- Position Entries Based on Fibs
- Fib Targets
- The Importance of the 0.28 Level & Profit Taking
Fibonacci
I’m primarily a Fibonacci trader. I use them for every single trade I take. The value they offer is the best there is in my opinion as a primary tool for assessing a trade (you still need confluence to enter a trade though!)
Here are the settings I use.
I’m primarily a Fibonacci trader. I use them for every single trade I take. The value they offer is the best there is in my opinion as a primary tool for assessing a trade (you still need confluence to enter a trade though!)
Here are the settings I use.


If you want to use the same Fib settings as I do, make sure that you save them by going to the ‘Template’ tab at the bottom left of the second image, and clicking ‘Save As’.
The Long Tool
The long tool on Tradingview is the bullishly biased traders best mate
Use and master this easy tool to understanding of your position in terms of % distance to stop loss from entry. See further down for position size calcs.
This is all in ref to Tradingview too
The long tool on Tradingview is the bullishly biased traders best mate
Use and master this easy tool to understanding of your position in terms of % distance to stop loss from entry. See further down for position size calcs.
This is all in ref to Tradingview too


The Short Tool
As opposed to the long tool, the short tool is the bears best mate if you feel that we’re going down faster than the markets after covid. Well, not that dramatic, but you get it.
As opposed to the long tool, the short tool is the bears best mate if you feel that we’re going down faster than the markets after covid. Well, not that dramatic, but you get it.


Position Sizing
Ok, so you’ve got a grasp now on fibs, and long and short position tools. Great.
What about sizing up your position though?
It can be hard to get, but hopefully this helps. Trust me, it is really simple when you get the hang of it.
Ok, so you’ve got a grasp now on fibs, and long and short position tools. Great.
What about sizing up your position though?
It can be hard to get, but hopefully this helps. Trust me, it is really simple when you get the hang of it.

How to Use Fibs
Righty-o, we’re at the meaty part now. Let’s take a look at how to use our fibs.
If you’ve read my Market Structure Thread, you’ll know that we use swing high’s and swing low’s to use as a basis of targets and entry points.
Quick recap below
Righty-o, we’re at the meaty part now. Let’s take a look at how to use our fibs.
If you’ve read my Market Structure Thread, you’ll know that we use swing high’s and swing low’s to use as a basis of targets and entry points.
Quick recap below


Fib placements - Bullish
The way that I trade is per the below:
Identify an area of interest, and if looking for a long position, pull a fib from the swing low of a move to the swing high.
I personally pull the fibs to the wicks as I’ve found that this fits the bill nicely
The way that I trade is per the below:
Identify an area of interest, and if looking for a long position, pull a fib from the swing low of a move to the swing high.
I personally pull the fibs to the wicks as I’ve found that this fits the bill nicely


Now, this is where the magic happens.
Notice that the price falls between the 0.618 to 0.79 retracement levels of the fib before blasting back off to the highs?
I will never, ever, enter a trade unless I have set this tool up in this way, and price has entered this region.
Notice that the price falls between the 0.618 to 0.79 retracement levels of the fib before blasting back off to the highs?
I will never, ever, enter a trade unless I have set this tool up in this way, and price has entered this region.
In my experience, these areas give you the best position entry to take advantage of a move.
I personally vouch for waiting for price to enter this area though, and when price shows signs of continuing the trend, I would then step in to enter a long in this case.
I personally vouch for waiting for price to enter this area though, and when price shows signs of continuing the trend, I would then step in to enter a long in this case.
Fib placements - Bearish
Ok, so now we are getting comfy with bullish set ups. How about bearish setups? The market swings both ways right, so why not take advantage of not only ups, but downs also.
Notice the same levels on the fibs that price falls back into?
Ok, so now we are getting comfy with bullish set ups. How about bearish setups? The market swings both ways right, so why not take advantage of not only ups, but downs also.
Notice the same levels on the fibs that price falls back into?


Big Cojones
Make no mistake; it can certainly be intimidating when you are entering trades on down candles when bullish, and up candles when bearish, but you will build the mindset of understanding the market dynamics and will soon have the cojones to pull the trigger.
Make no mistake; it can certainly be intimidating when you are entering trades on down candles when bullish, and up candles when bearish, but you will build the mindset of understanding the market dynamics and will soon have the cojones to pull the trigger.
These are the best entries, but make sure that you watch and paper trade this technique hundreds of times before putting your cock on the block with cold hard cash (sorry ladies, figure of speech)
Entries – Bull
I always will open up the long or short tool, and then after I’ve pulled my fibs, I will then place the SL just above the ‘1’ level, and generally target the ‘0’ position
My preference for entry is the 0.705 level, but you will find that the 0.618 hits a lot too
I always will open up the long or short tool, and then after I’ve pulled my fibs, I will then place the SL just above the ‘1’ level, and generally target the ‘0’ position
My preference for entry is the 0.705 level, but you will find that the 0.618 hits a lot too

Position Size - Bull
Note that this move is a 2.24R, and the SL is 0.52% from entry.
Based on our calcs before:
We are stumping up $19.23k capital while only risking $100. Our target of 2.24R means that we are looking for 2.24 x our risked amount for $224
Note that this move is a 2.24R, and the SL is 0.52% from entry.
Based on our calcs before:
We are stumping up $19.23k capital while only risking $100. Our target of 2.24R means that we are looking for 2.24 x our risked amount for $224

Entries – Bear
Same as when bullish, I always will open up the long or short tool, and then after I’ve pulled my fibs, I will then place the SL just above the ‘1’ level, and generally target the ‘0’ position.
The reason for this is on the image.
Same as when bullish, I always will open up the long or short tool, and then after I’ve pulled my fibs, I will then place the SL just above the ‘1’ level, and generally target the ‘0’ position.
The reason for this is on the image.

Position Size - Bear
Note that this move is a 2.6R, and the SL is 0.68% from entry.
Based on our calcs before, our position size would be per the below.
We are stumping up $14.7k capital while only risking $100. Our target of 2.6R = $260 profit
Note that this move is a 2.6R, and the SL is 0.68% from entry.
Based on our calcs before, our position size would be per the below.
We are stumping up $14.7k capital while only risking $100. Our target of 2.6R = $260 profit

Note
If you are looking at the position sizes and not sure how the hell you’re going to manage to stump up that much capital, don’t stress. Either work on bigger moves in terms of SL placement from entry, or employ the use of leverage.
If you are looking at the position sizes and not sure how the hell you’re going to manage to stump up that much capital, don’t stress. Either work on bigger moves in terms of SL placement from entry, or employ the use of leverage.
Leverage is not recommended for new traders, but I will show you how to use it responsibly as a tool in another thread in future.
You will realize that leverage is an amazing tool to use for a small account size. It HAS to be used responsibly though.
You will realize that leverage is an amazing tool to use for a small account size. It HAS to be used responsibly though.
Ok folks, so we’ve now covered a lot of ground. Please go back over the above if you need to. We are now about to take a look at extending ourselves beyond the 0 level on the fibs and looking to take profits in the short term as well as extending beyond the fibs we are using.
Profit Taking - Bullish
Let’s revisit the bullish scenario that we set our fibs up on.
What I will recommend to new traders is this:
Take profits early, and bring your stop loss up to break even at the right time for a risk free trade.
Let’s revisit the bullish scenario that we set our fibs up on.
What I will recommend to new traders is this:
Take profits early, and bring your stop loss up to break even at the right time for a risk free trade.
As price continues upwards, you can then trail your stop loss so that you are taking profits and also possibly stopped out in profits too
Note that in this example, we’ve increased our R from 2.24 to 5.36 for a full move, but would be reduced due to profit taking along the way
Note that in this example, we’ve increased our R from 2.24 to 5.36 for a full move, but would be reduced due to profit taking along the way

Profit Taking - Bearish
Same as the bullish move, here are some examples for a bearish trade:
Note that in this example, we’ve increased out R from 2.6 to 5.47 for a full move, but this would be reduced due to profit taking along the way.
Same as the bullish move, here are some examples for a bearish trade:
Note that in this example, we’ve increased out R from 2.6 to 5.47 for a full move, but this would be reduced due to profit taking along the way.

How to structure your Take Profit
You can use an arbitrary method like this :
TP1 = 0.28 level of the fib, 20%
TP2 = 0 level of the fib, 20%
TP3 = -0.27 of the fib, 20%
TP4 = -0.62 of the fib, 20%
TP5 = -1 of the fib, 20%
You can use an arbitrary method like this :
TP1 = 0.28 level of the fib, 20%
TP2 = 0 level of the fib, 20%
TP3 = -0.27 of the fib, 20%
TP4 = -0.62 of the fib, 20%
TP5 = -1 of the fib, 20%
It’s up to you though. In the bullish case, you can see that we didn’t hit the final TP. Had we been trailing our SL, then we would be stopped out in profits, but you need to work out what fits your trading personality
The importance of the 0.28 Level
So here’s something that is going to save your arse a few times along the way. There is a relationship between the 0.28 level on the fib that coincides with another fib level if trading in the opposite way.
So here’s something that is going to save your arse a few times along the way. There is a relationship between the 0.28 level on the fib that coincides with another fib level if trading in the opposite way.
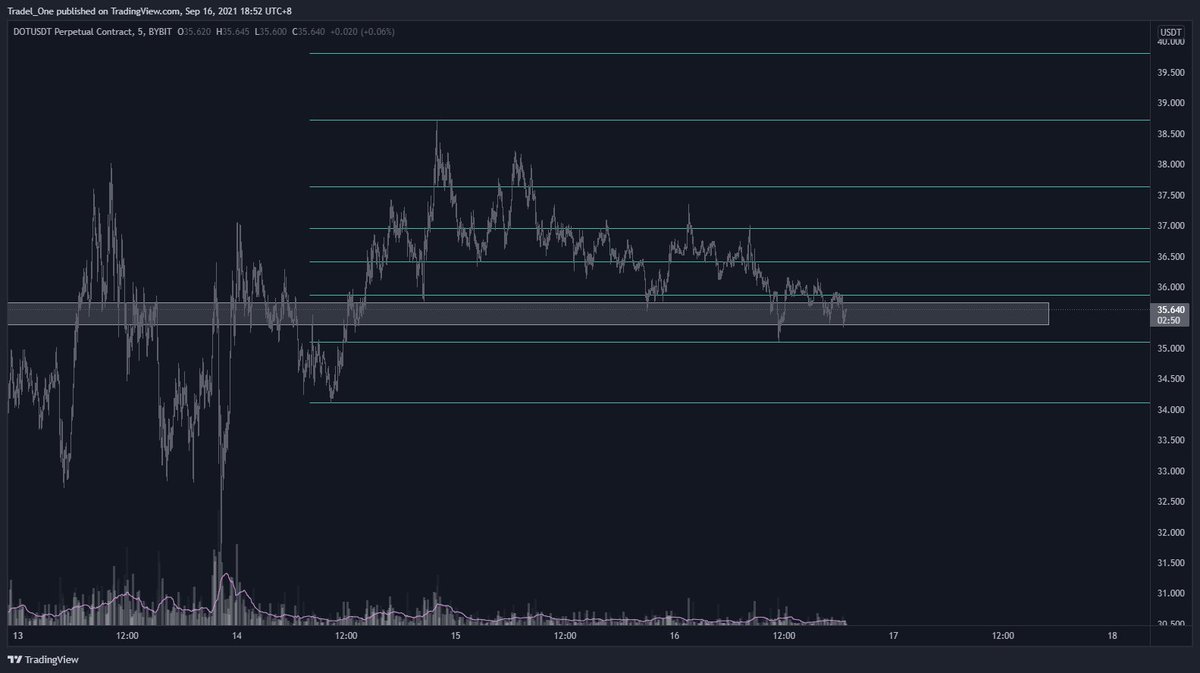
Please see below from ETH. This is actually a trade I took:
Entry made per the method in this thread:
Entry made per the method in this thread:

I was very weary of swing failures occurring, so I made sure that I took profits at the 0.28 level and then moved my SL to break even.
You can see that as soon as the 0.28 level is hit, price runs up and would blow this trade out of the water.
You can see that as soon as the 0.28 level is hit, price runs up and would blow this trade out of the water.
What was the reason?
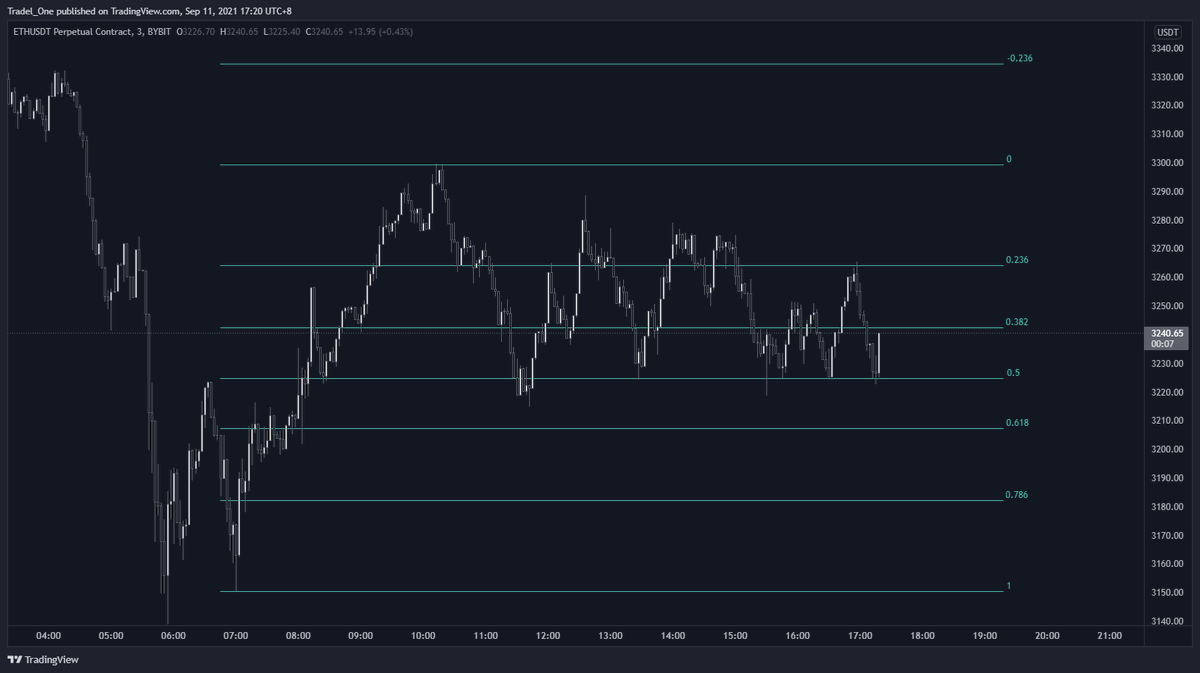
I’ll show two images here. The first is the move in the opposite direction with the fibs in accordance with this method I am sharing with you, and the next will be both the original trade fibs and the opposite shown together (fibs shown in different colours)
I’ll show two images here. The first is the move in the opposite direction with the fibs in accordance with this method I am sharing with you, and the next will be both the original trade fibs and the opposite shown together (fibs shown in different colours)


On the second image in the tweet above, you can see that the 0.28 level from the first move, and the 0.618 level from the second move are exactly aligned.
This means that there are massive amounts of interest, bots buying, algos kicking in etc at these levels. Luckily I placed my stop loss to break even as price then shot straight off in the other direction
So the lesson to be aware of? Take profits where you can
So the lesson to be aware of? Take profits where you can
Conclusion
So we’ve been through a bit of a journey here from basics to some more advanced levels.
It can be mind blowing or hard to wrap your head around, but please, stick with it, ask many questions, and keep at it.
So we’ve been through a bit of a journey here from basics to some more advanced levels.
It can be mind blowing or hard to wrap your head around, but please, stick with it, ask many questions, and keep at it.
Please comment below with what you are having trouble with trading on, and I’ll help where I can.
Go and study this material, backtest until you are satisfied, get comfy with it, and study how price performs.
Go and study this material, backtest until you are satisfied, get comfy with it, and study how price performs.
I personally just took a break from posting to go and absorb myself into the nuances of price action and how markets breath in terms of fractals and repeating moves.
It will take hundreds of hours for you to feel comfy with trading, but let’s do it together yeah?
It will take hundreds of hours for you to feel comfy with trading, but let’s do it together yeah?
Thank you very much for reading if you got this far, and please, if you think that this will help someone along the way, please feel free to share if you would like to.
Cheers
-Mindset
Cheers
-Mindset
Equation to work out leverage pos size. Work out your SL % from entry first. Use 1.5% in this case and 20x leverage as an eg
Capital risked/ (Stop loss decimal x leverage amt) = equity needed
$10 / (0.015 x 20) = $33.33
Risking $10, your equity needed is $33.33 at 20x leverage
Capital risked/ (Stop loss decimal x leverage amt) = equity needed
$10 / (0.015 x 20) = $33.33
Risking $10, your equity needed is $33.33 at 20x leverage
Beg your pardon everyone - there were some poor quality images in the thread.
Please refer to the hi res PDF found here for clearer images as referenced above:
drive.google.com/file/d/1GzG6ZJ…
Please refer to the hi res PDF found here for clearer images as referenced above:
drive.google.com/file/d/1GzG6ZJ…
• • •
Missing some Tweet in this thread? You can try to
force a refresh