Mini Case Study Thread

Building Your Trading Idea:

So we talk about finding confluence with moves and trying to build a bit of narrative for where price is likely to reach up or down to

I'll take a look here at how a possible $UNI trade could be developed:
Start with HTF key closes ie Monthly, Weekly, and Daily.

I've gone ahead and marked these up, but consolidated on the Daily Chart
Here's a 4H version of these levels.

Note how price acts within these key HTF zones
Using the VPVR tool from Tradingview, we can see where the most volume has taken place within the area that we are looking at on the chart.

Notice that we are just trading above the Point of Control for this area (and also just below the recent monthly close)
So are we bearish or bullish? In this case, let's explore with fibs and PA

We're looking like we've had two higher lows, followed by a rally up past recent market structure (shaded rectangle) and formed a swing high.

(HTF levels turned off for clarity)
We'd expect price to fall back to the 0.618 - 0.705 levels, but with instances of sharp moves like this (think flags etc), you'll find that price respects the 0.382 and 0.5 levels more than our usual targets.

And, we have seen a bit of a spike at the 0.5 level per the chart.
On the 1H chart, we also see a rounded bottom / reversal move play out, which supports our hypothesis.

In this case, I would be bullish.
Taking it the next level down to the 15M TF, we turn our HTF levels back on, and then also include our favourite suite of entry / exit / target fibs
If pull your fibs in anticipation of where a bullish trade could run into trouble, you find confluence with:

- A weekly level
- The 0.618 to 0.79 levels of the fibs
- Not only that, but you'd also find that there was a previous POC in between the 0.618 and 0.705 levels
And entry and targets?

See below for an example of a trade based on retracement to realistic market structure, and then an end goal of the Daily swing high, with profits taken at the Weekly level / POC interface explored above / reverse fib zones.
Stop Loss *could* be placed below the HTF recent lows, or if aggresive, then at more local swing lows

This example is a 3.45R trade
And what if price flips and is bearish I hear you ask?

Well, you've now got the tools to at least formulate a plan...we aren't always right, but as long as we've got a plan, this is half the battle hey?

Hope this helped you on your journey, and happy trading

- Mindset

• • •

Missing some Tweet in this thread? You can try to force a refresh
 

Keep Current with Mindset ⚖️

Mindset ⚖️ Profile picture

Stay in touch and get notified when new unrolls are available from this author!

Read all threads

This Thread may be Removed Anytime!

PDF

Twitter may remove this content at anytime! Save it as PDF for later use!

Try unrolling a thread yourself!

how to unroll video
  1. Follow @ThreadReaderApp to mention us!

  2. From a Twitter thread mention us with a keyword "unroll"
@threadreaderapp unroll

Practice here first or read more on our help page!

More from @Mindset_BTC

16 Sep
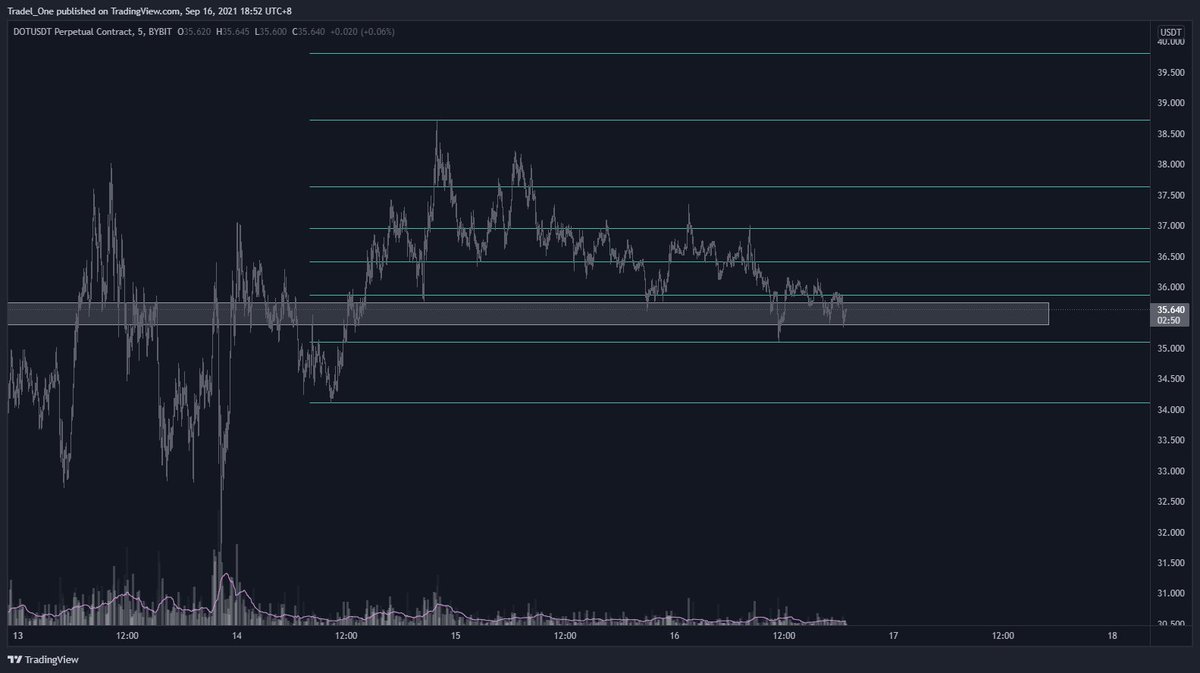
A little snippet into a current trade of mine right now - $DOT

A mini day trade thread:

- First open the chart and assess the Price Action
- What we see is some previous market structure broken per the rectangle
- We've also now had 4 taps of support here Image
Now we set up our HTF fibs as shown, and then also check the volume

- Note that there was a large amount of volume to support the larger move, with much lower volume now where price is trading Image
Then we add our fibs on to suit as we love to do Image
Read 7 tweets
11 Sep
I want to introduce you to a technique that is really simple and easy to work with on all timeframes.

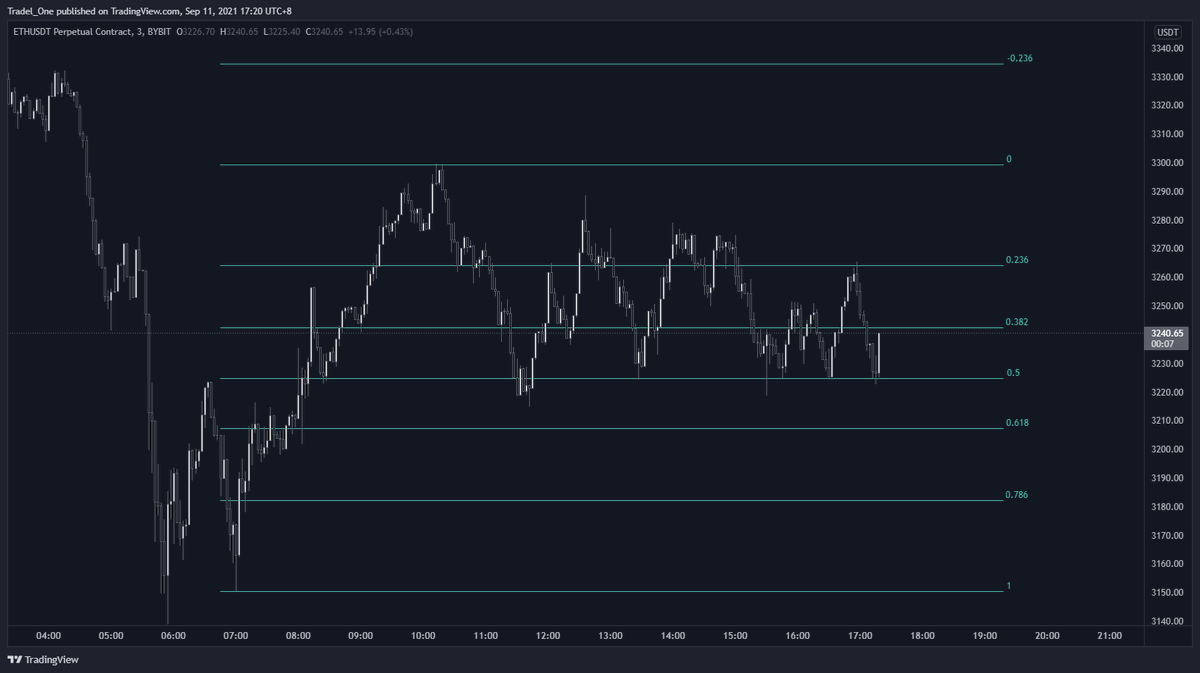
I just took this winning scalp trade then on $ETH 3min chart

This works on $BTC $SOL $AXS $MOVR $DOT $MATIC, you name it (shameless reach tags sorry).
Start with your chart on the correct timeframe:

-3min

Then pull a set of fibs from the swing low of the move to the swing high as shown

- Use the standard fib suite, but make sure the colours work for you
Add the Stochastic RSI tool (SRSI), it's free on @tradingview. If you aren't sure on entry and exit, this will really help you

There are two lines, K, and D.

When the K line (blue) is above the 80 level (shown dashed) & crosses the D (orange) this is a sell signal (overbought)
Read 8 tweets
9 Sep
🚨Anti FOMO Alert 🚨

Obervation on $BTC at the moment:

- We've hit the 0.618 fib of a higher time frame &clearly seen some rejection
- Based on the move, we should now build a narrative
- History has doesn't repeat itself, but it does rhyme Image
We can call this move a bear flag at the moment, and the key thing is to recognize how price reacts as the 0.382 fib level of a bear flag

- Note the ellipses shown here for reference Image
Now to check out some Volume Profile:

We're at the VaH of the VPVR - in a parallel channel we usually short at the tops of these, so there would have been a lot of selling interest here, coupled with the 0.618 hit of the overall HTF Image
Read 8 tweets
3 Sep
Mini Thread on confluence:

When carrying out TA, you've got to build confluence. Here is how I would build this $BTC trade:

1st Pic - VPVR tool on TV shows we are at Value Area High of the recent price action
Second image introduces a parallel channel to the mix

We usually short at the highs of the channel, and long at the lows, taking profit or closing trades at the mid line (this works until it doesn't - you will end up losing a trade doing this in each channel)
Third image introduces HTF fibs into the mix

Note how well these levels are respected when pulled from the swing low of the move to the swing high
Read 5 tweets
28 Aug
🚨Thread Alert🚨

Trade Entry & Exit - a Deep Dive

Sick of getting stopped out, taking a shitty entry, or generally feel like you gettin your arse whooped in trading?

If so, you’re in luck my friends - I’ve knocked up this whizz bang, you beaut thread for you:

✍️📒
Agenda

- Setting Up Fibonacci (Fibs)
- Long & Short Tool
- Position Size Calc
- How to Use Fibs
- Position Entries Based on Fibs
- Fib Targets
- The Importance of the 0.28 Level & Profit Taking
Fibonacci
I’m primarily a Fibonacci trader. I use them for every single trade I take. The value they offer is the best there is in my opinion as a primary tool for assessing a trade (you still need confluence to enter a trade though!)
Here are the settings I use.
Read 38 tweets
1 Aug
CAPITAL PRESERVATION THREAD

If you’re reading this, there is a good chance that you’ve had your arse handed to you by not preserving your capital effectively enough.

If this sounds familiar, read on.

Let’s explore how to preserve your capital 💵

A thread;

👇
You can’t be successful in trading unless you can:

A) Control your emotions;

and

B) Preserve your capital;

You simply CANNOT win in this game unless you learn how to lose like a pro
You may have a $100, or $1k, or $10k trading account – it doesn’t matter

What does matter is that you stick to strict capital preservation rules that you must follow

Look at the odds of losing ‘x’ amount of trades in 100 trades: Image
Read 20 tweets

Did Thread Reader help you today?

Support us! We are indie developers!


This site is made by just two indie developers on a laptop doing marketing, support and development! Read more about the story.

Become a Premium Member ($3/month or $30/year) and get exclusive features!

Become Premium

Too expensive? Make a small donation by buying us coffee ($5) or help with server cost ($10)

Donate via Paypal Become our Patreon

Thank you for your support!

Follow Us on Twitter!

:(