Most beginners when building a trading strategy simply use current info and test with it, they don't know How to Get Historical Stock Futures lot size, list of stocks that are part of index like Nifty 50, Nifty 500 historically, I will share all such info in this thread
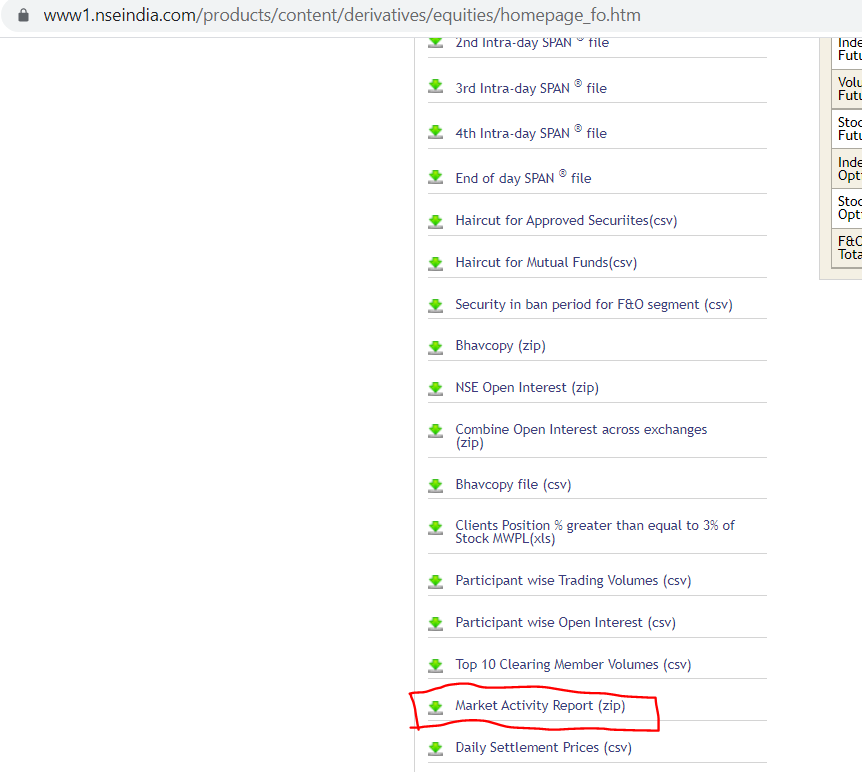
Please note that there is no way to get the historical lot size of stocks futures, NSE don't publish it directly, so we need to do some calculated steps to get that data. Download Market Activity report www1.nseindia.com/products/conte… 
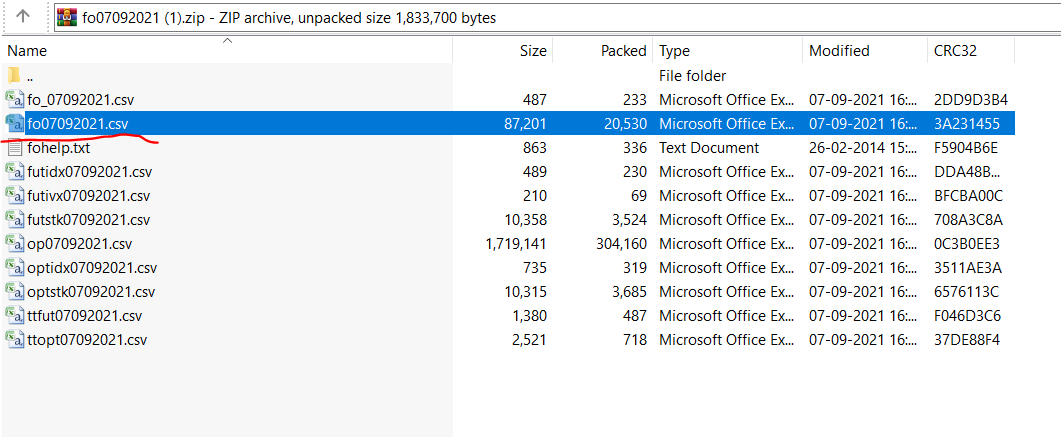
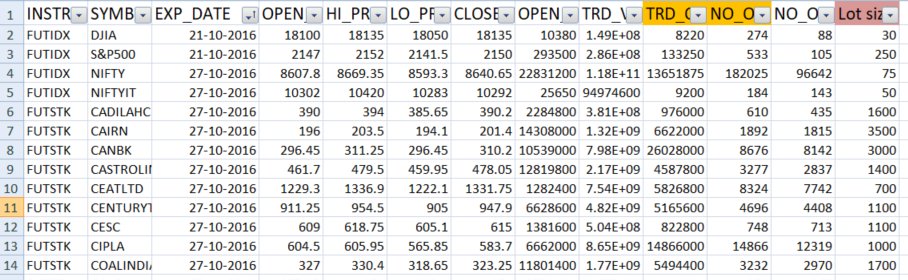
The zip file contains multiple files, open the second file.
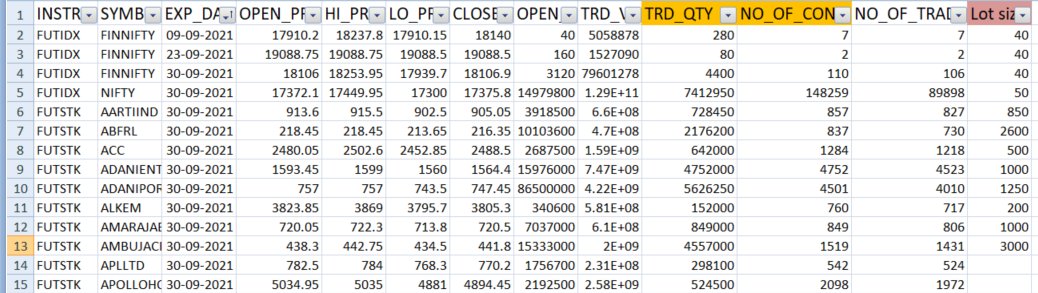
The file will contain stock symbol, expiry date, OHLC data, along with that you get traded quantity and No of contracts traded, using this data we can calculate the lot size of every stock symbol. Simply divide Traded QTY / NO of contracts gives you the lot size.
So to get the historical stock futures data, all you need to do is change the date in the below link
www1.nseindia.com/archives/fo/mk… For an example, to get the historical stock futures lot size data for Sep 2016, use www1.nseindia.com/archives/fo/mk…
www1.nseindia.com/archives/fo/mk… For an example, to get the historical stock futures lot size data for Sep 2016, use www1.nseindia.com/archives/fo/mk…
If you want to download the FnO stocks and their lot size for current month, you can simply go to www1.nseindia.com/content/fo/fo_…
When you are designing a stock trading system based on certain universe like Nifty 50, Nifty 500 etc, it is important to test the strategy with list of stocks that are part of these indices historically.
If you test the strategy with current Nifty 50 or Nifty 500 stocks, you will get extraordinary results due to survivorship bias. Don't do that mistake. Stocks like DLF, RCOM, UNITECH were part of Nifty 50 in 2008, not any more.
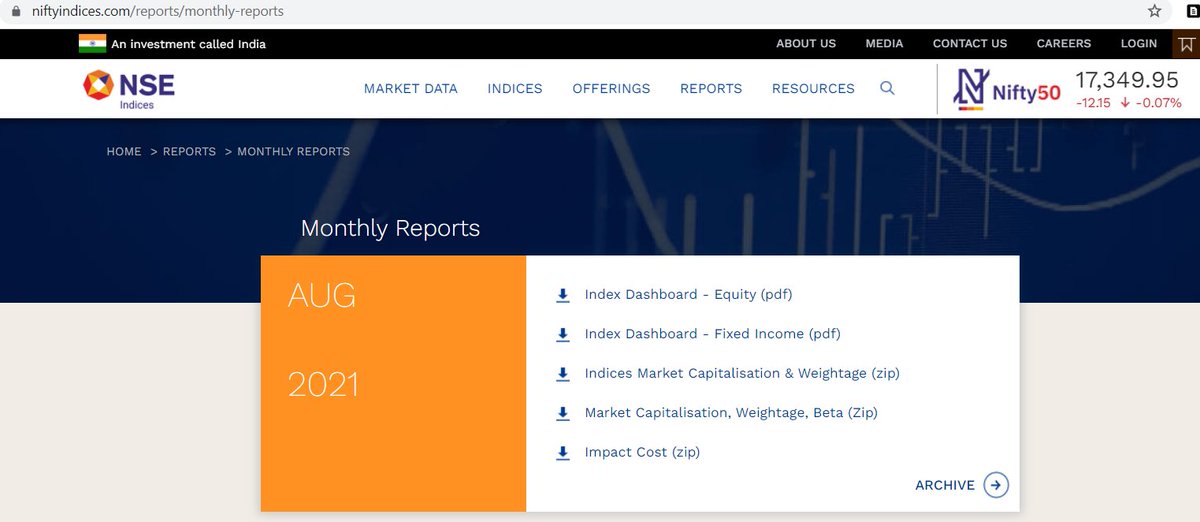
To get Historical constituents of Nifty Index data, go to niftyindices.com/reports/monthl… which will show you current month list of stocks that are part of different indices. Click on Archive
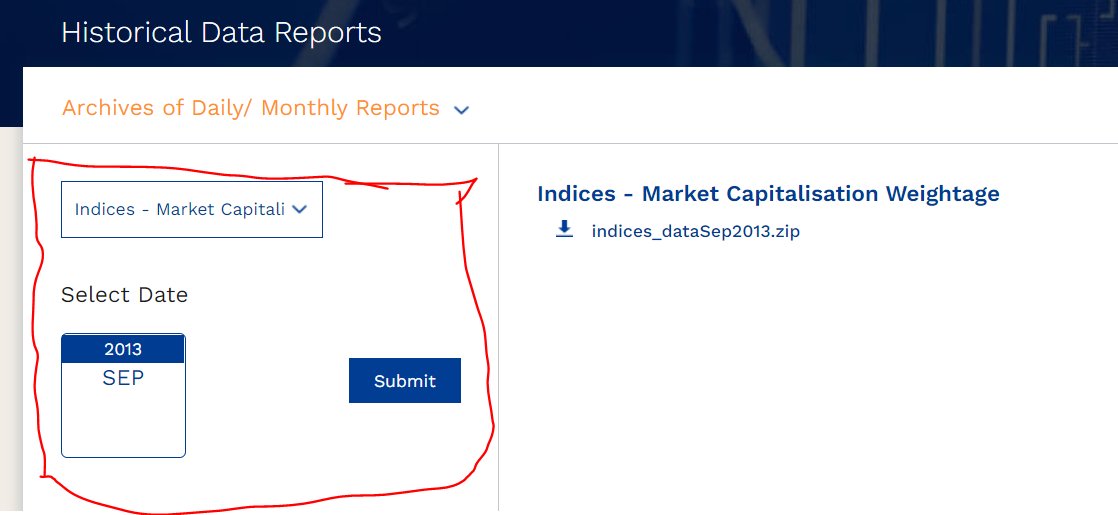
Select Indices - Market Capitalization from drop down and select historical month/year, click on submit. It will generate a zip file which will contain the required information.
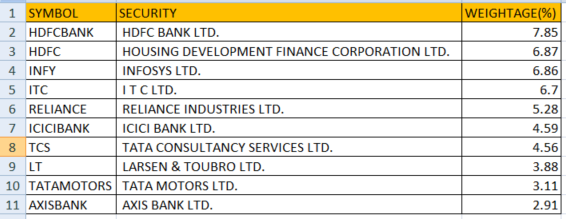
Not only for Nifty 50, Nifty 500, you can get the list of stocks that are part of each index.

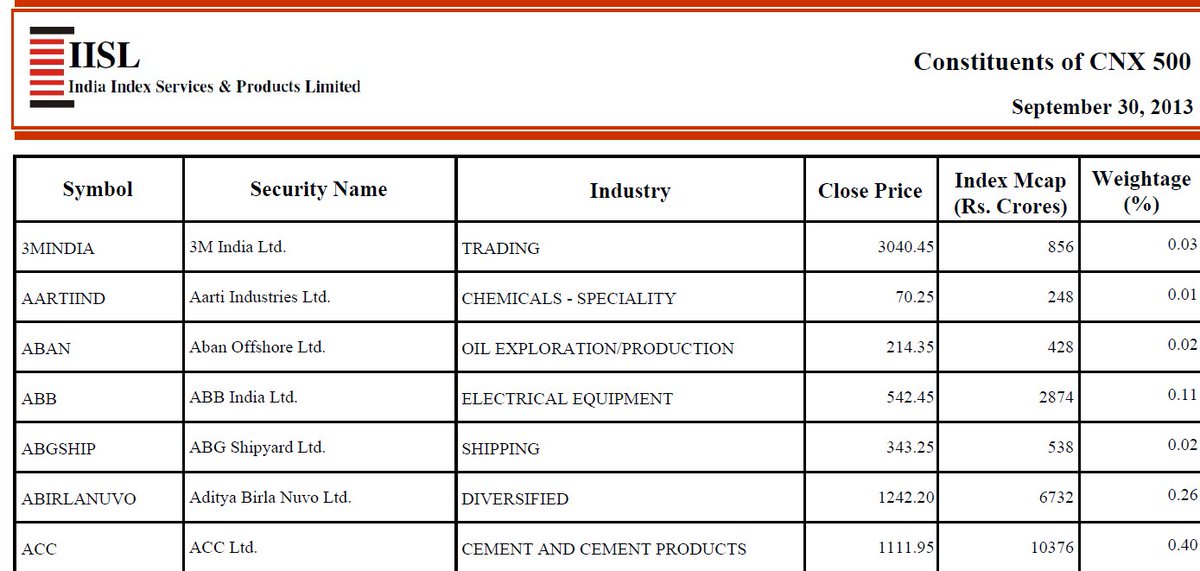
Once you open the PDF file, you can see the stock symbol, full name, which industry it belongs to and their weightage with respect to index.
So to get the historical stocks list for different indices, all you need to do is change the month/year in the below link
www1.nseindia.com/content/indice…
For an example, to get the historical constituents of all index for Aug 2013, i will use www1.nseindia.com/content/indice…
www1.nseindia.com/content/indice…
For an example, to get the historical constituents of all index for Aug 2013, i will use www1.nseindia.com/content/indice…
The top 10 stocks of Nifty 50 determines the over all direction of the markets And this top 10 varies at frequent intervals. So to get the historical TOP 10 Nifty 50 stocks, all you need to do is change the date/month/year in the below link
www1.nseindia.com/content/indice…
www1.nseindia.com/content/indice…
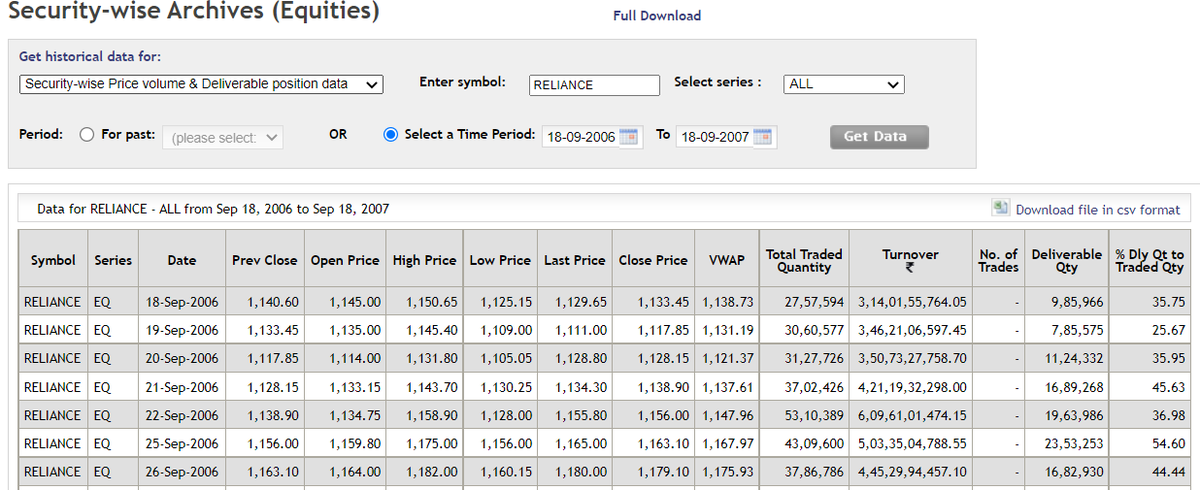
You can download end of the data from NSE for all equity cash segment stocks Go to www1.nseindia.com/products/conte…
enter the stock symbol and date criteria for which you want to download the data
enter the stock symbol and date criteria for which you want to download the data
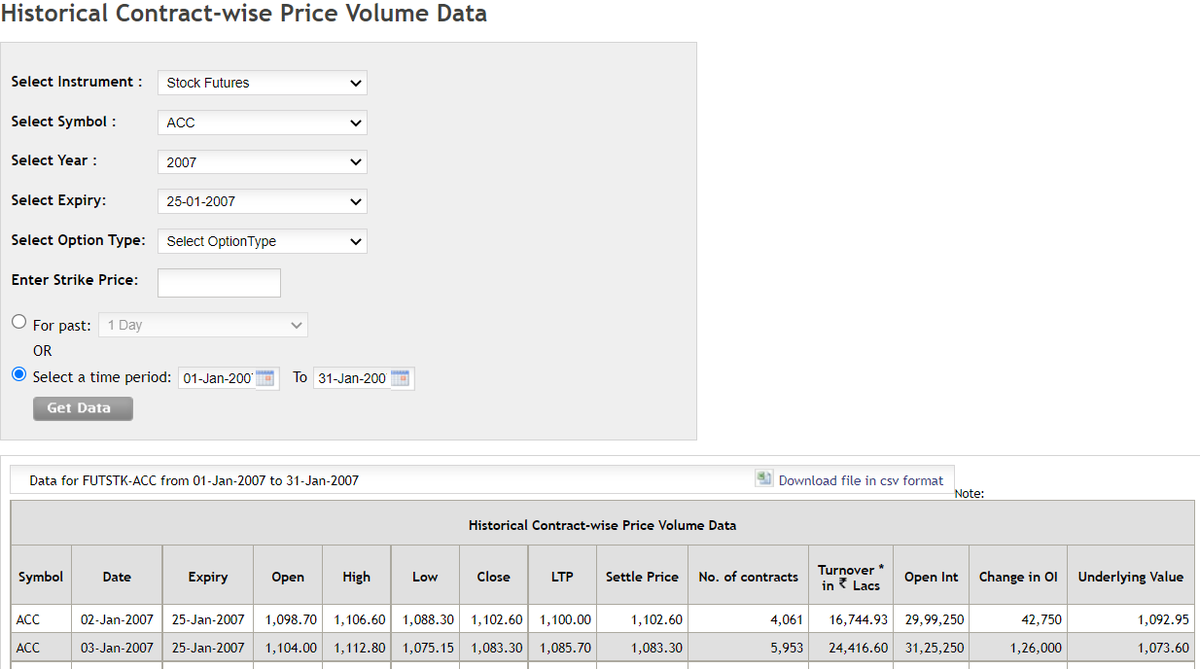
To get the stock futures historical data, go to the below link select the symbol, year, expiry period and time period for which you wan to download the data
www1.nseindia.com/products/conte…
www1.nseindia.com/products/conte…
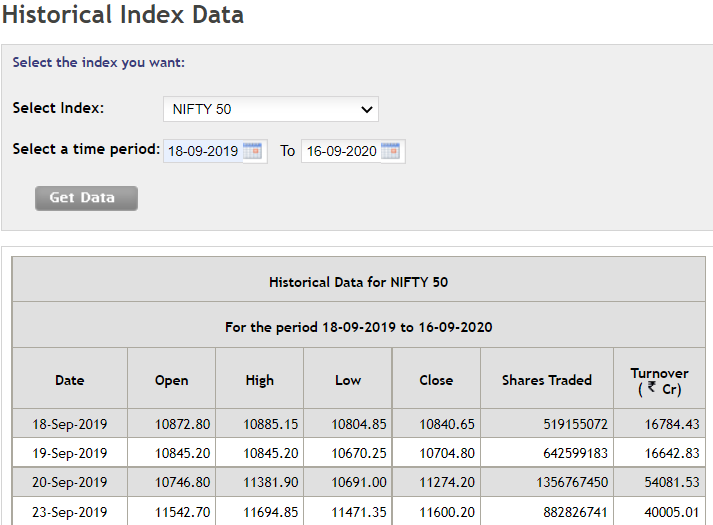
To get the Index spot data, go to below link and select the index from drop down and give the time period.
www1.nseindia.com/products/conte…
www1.nseindia.com/products/conte…
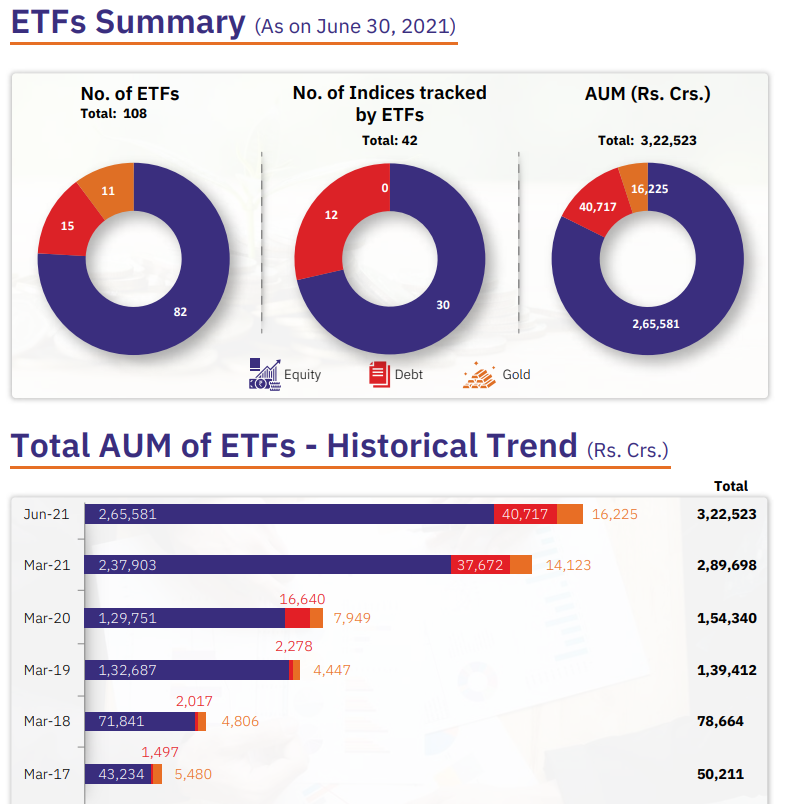
List of all ETFs:
To get the list of all Exchange Traded funds listed in NSE, just go this link www1.nseindia.com/content/equiti…
To get the list of all Exchange Traded funds listed in NSE, just go this link www1.nseindia.com/content/equiti…

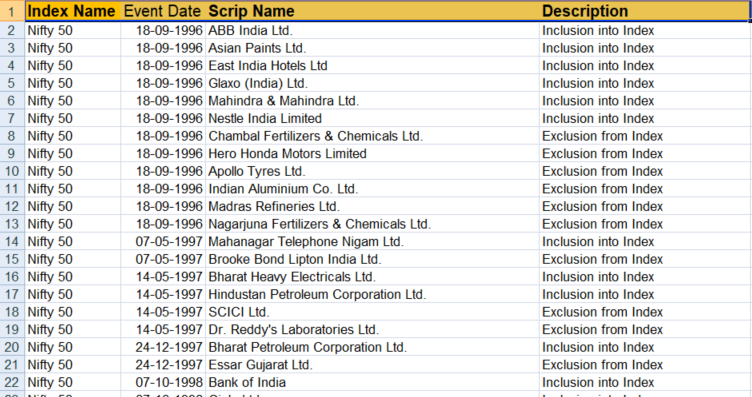
In last 25 years there were many stocks which was included in Nifty 50 and stocks that did not perform well were removed from Nifty 50. List of stocks that were added to different index and removed from different index data is available in this link
niftyindices.com/Monthly_Report…
niftyindices.com/Monthly_Report…
The complete information has been drafted as a blog post and shared here, check it out. squareoff.in/how-to-get-his…
• • •
Missing some Tweet in this thread? You can try to
force a refresh