🚨Anti FOMO Alert 🚨
Obervation on $BTC at the moment:
- We've hit the 0.618 fib of a higher time frame &clearly seen some rejection
- Based on the move, we should now build a narrative
- History has doesn't repeat itself, but it does rhyme
Obervation on $BTC at the moment:
- We've hit the 0.618 fib of a higher time frame &clearly seen some rejection
- Based on the move, we should now build a narrative
- History has doesn't repeat itself, but it does rhyme

We can call this move a bear flag at the moment, and the key thing is to recognize how price reacts as the 0.382 fib level of a bear flag
- Note the ellipses shown here for reference
- Note the ellipses shown here for reference

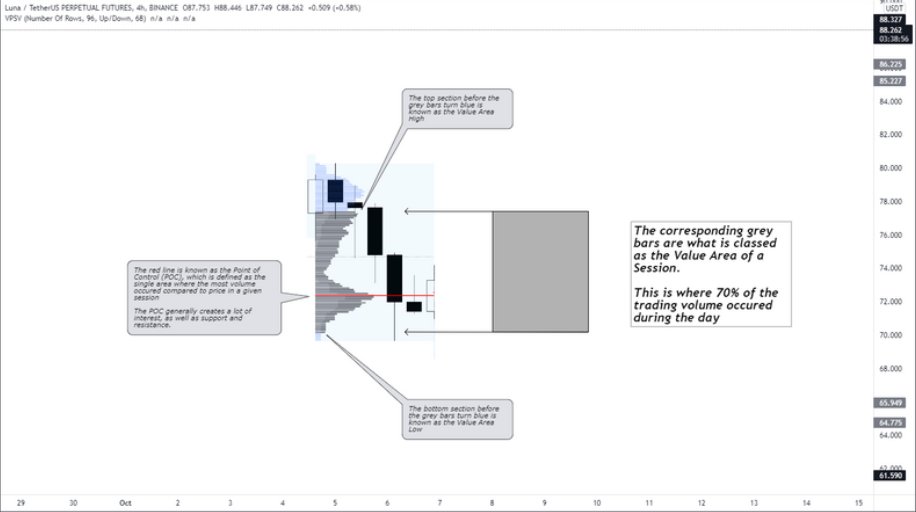
Now to check out some Volume Profile:
We're at the VaH of the VPVR - in a parallel channel we usually short at the tops of these, so there would have been a lot of selling interest here, coupled with the 0.618 hit of the overall HTF
We're at the VaH of the VPVR - in a parallel channel we usually short at the tops of these, so there would have been a lot of selling interest here, coupled with the 0.618 hit of the overall HTF

So when we delve into the VPSV we can see that, like clockwork, the naked point of control is hit at the $44.4k ish area.
Let's look at other areas below next
Let's look at other areas below next

Here are a couple more areas that are of significant interest, given the liquidity resting in these areas.
We've got a couple more confluence areas to take a look at, so bear with me (pardon the pun)
We've got a couple more confluence areas to take a look at, so bear with me (pardon the pun)

When we pull our fibs from the swing low to swing hight of the overall move, we see that there is a naked point of control that lines up almost perfectly with the 0.618 level.

That's not all though, we've also got a new tool that you haven't seen me use yet which is the fib fan tool.
Pulled from the extreme low to recent high, the fibs will be similar anyway to our horizontals, but this adds that extra bit of confluence along the way
Pulled from the extreme low to recent high, the fibs will be similar anyway to our horizontals, but this adds that extra bit of confluence along the way

So this mini thread presents a bearish case in this instance, but this at least gives you an idea of how to frame a trade for yourself.
We can't always be moonboi like, and although alts are popping, it pays to assess the king $BTC and be cautious and not FOMO in.
- Mindset
We can't always be moonboi like, and although alts are popping, it pays to assess the king $BTC and be cautious and not FOMO in.
- Mindset
• • •
Missing some Tweet in this thread? You can try to
force a refresh