
So excited to announce the initial release of {gtExtras}, a #rstats 📦 providing "extras for {gt} tables!
🎉🎉🎉
Includes:
💅 4 full themes
🛠️ 12 utility/formatting functions
📊 5 inline plot types
🎨 3 built in color tools
Thread below of functions:
jthomasmock.github.io/gtExtras/
🎉🎉🎉
Includes:
💅 4 full themes
🛠️ 12 utility/formatting functions
📊 5 inline plot types
🎨 3 built in color tools
Thread below of functions:
jthomasmock.github.io/gtExtras/
This package is highlighting capabilities that are all _possible_ with {gt} but have repeated boilerplate or wrap multiple function calls internally.
If you haven't updated {gt} recently, make sure to update as gt v0.3 added full support for tidyeval!
gt.rstudio.com/news/index.htm…
If you haven't updated {gt} recently, make sure to update as gt v0.3 added full support for tidyeval!
gt.rstudio.com/news/index.htm…
With full support for tidyeval in {gt} and in specific functions in {gtExtras}, you can reference columns and rows just as you would in {dplyr}. You also get all the power of things like:
where(is.numeric)
starts_with("name")
dplyr.tidyverse.org/reference/dply…
where(is.numeric)
starts_with("name")
dplyr.tidyverse.org/reference/dply…
Fun fact - in about 20 lines of #rstats code you can scrape a table from @FiveThirtyEight , convert the text to a dataframe, and then recreate the _exact_ table with {gt}/{gtExtras}
Code: gist.github.com/jthomasmock/4c…
@friscojosh Data source: fivethirtyeight.com/features/runni…
Code: gist.github.com/jthomasmock/4c…
@friscojosh Data source: fivethirtyeight.com/features/runni…


Maybe you're more of a fan of ESPN, the NY Times, or The Guardian? There are themes for those too!
ESPN: jthomasmock.github.io/gtExtras/refer…
NYTimes: jthomasmock.github.io/gtExtras/refer…
Guardian: jthomasmock.github.io/gtExtras/refer…
ESPN: jthomasmock.github.io/gtExtras/refer…
NYTimes: jthomasmock.github.io/gtExtras/refer…
Guardian: jthomasmock.github.io/gtExtras/refer…


Maybe you want to have an inline indicator for positive/negatives? We have that too!
With one function call, add in-line "pill" plots indicating wins/losses or positive/negatives! Choose your own palette or use the default.
jthomasmock.github.io/gtExtras/refer…
With one function call, add in-line "pill" plots indicating wins/losses or positive/negatives! Choose your own palette or use the default.
jthomasmock.github.io/gtExtras/refer…

Ok, so maybe sparklines are more of what you're looking for. Show trends over time and then summary values in the table itself.
jthomasmock.github.io/gtExtras/refer…
jthomasmock.github.io/gtExtras/refer…

Maybe rather than showing trends, you want to show the percentages of each subgroup.
Check out the gt_plt_bar_stack function! It even includes the ability to dynamically change the column labels with colors and specific text.
jthomasmock.github.io/gtExtras/refer…
Check out the gt_plt_bar_stack function! It even includes the ability to dynamically change the column labels with colors and specific text.
jthomasmock.github.io/gtExtras/refer…

Beyond just plots, there are other ways to highlight data.
You can quickly highlight specific rows by number or by a logical match.
jthomasmock.github.io/gtExtras/refer…
You can quickly highlight specific rows by number or by a logical match.
jthomasmock.github.io/gtExtras/refer…

Want to add some type of unit or symbol to your numbers but still have them align properly? Check out fmt_symbol_first() - has support for specific characters (eg "%") or HTML codes ("%")
jthomasmock.github.io/gtExtras/refer…
jthomasmock.github.io/gtExtras/refer…

You can use the pad_fn() to pad numeric values so they align at the decimal place but don't require all the trailing zeroes!
jthomasmock.github.io/gtExtras/refer…
jthomasmock.github.io/gtExtras/refer…

You can also use gt_text_img() to add an image to the end of your table header. Useful for specifying the group you are working with, or possibly a company logo.
jthomasmock.github.io/gtExtras/refer…
jthomasmock.github.io/gtExtras/refer…

The gt_merge_stack() function allows you to merge two existing columns, and stack them for a more compact but rich display.
jthomasmock.github.io/gtExtras/refer…
jthomasmock.github.io/gtExtras/refer…
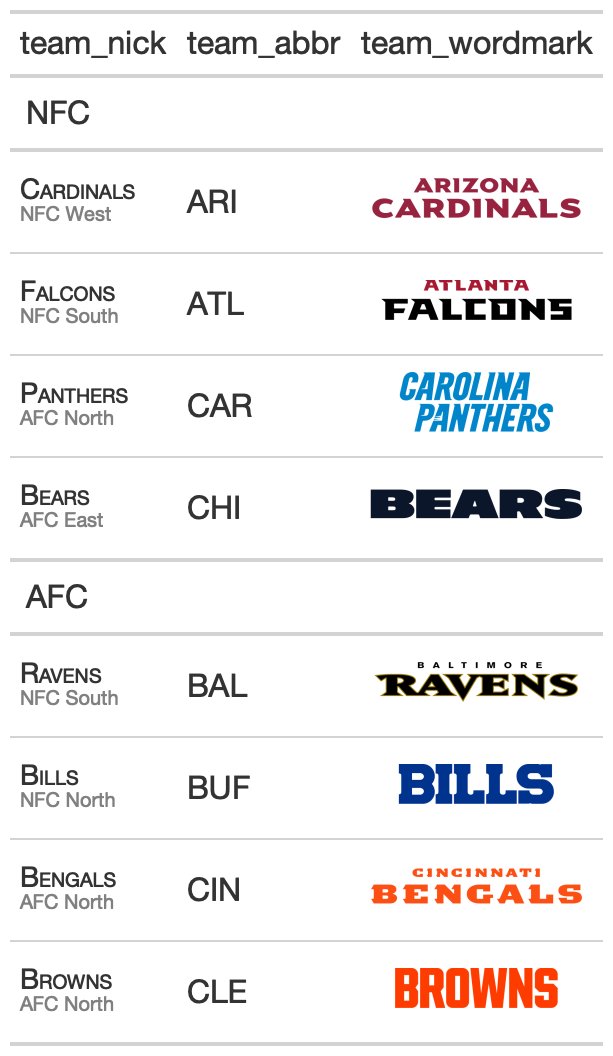
Want to know how those inline logos were added? That is gt_image_rows() which allows you to replace inline text representing the image with the actual image!
jthomasmock.github.io/gtExtras/refer…
jthomasmock.github.io/gtExtras/refer…

There are also helpers for applying max/min functions by group, so you can highlight specific values in a grouped gt table.
jthomasmock.github.io/gtExtras/refer…
jthomasmock.github.io/gtExtras/refer…

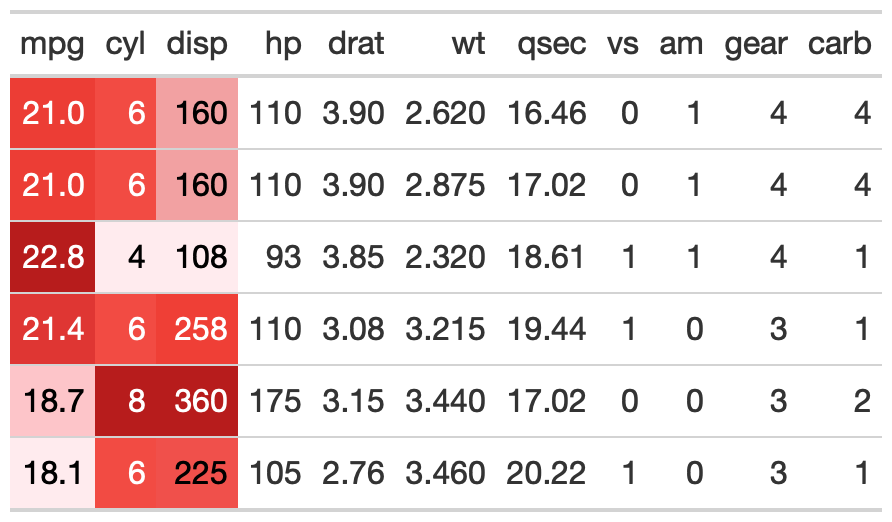
Lastly, there are color palette functions - the gt_hulk_col_numeric() functions applies the hulk palette ("purple" and "green") as a heatmap within a column or across the table.
jthomasmock.github.io/gtExtras/refer…
jthomasmock.github.io/gtExtras/refer…

Alternatively, the gt_color_rows() function is a wrapper around {paletteer} and gt::data_color() that lets you quickly apply colors to the table. {paletteer} provides dozens of built-in palettes, and the function supports discrete or continuous values.
jthomasmock.github.io/gtExtras/refer…
jthomasmock.github.io/gtExtras/refer…

More features will be built into the package over time, so give it a try and let me know what type of other features you would like to see for HTML tables!
jthomasmock.github.io/gtExtras/refer…
jthomasmock.github.io/gtExtras/refer…
• • •
Missing some Tweet in this thread? You can try to
force a refresh


