#COVID19AB Balanced Scorecard
Fri 9 Sep
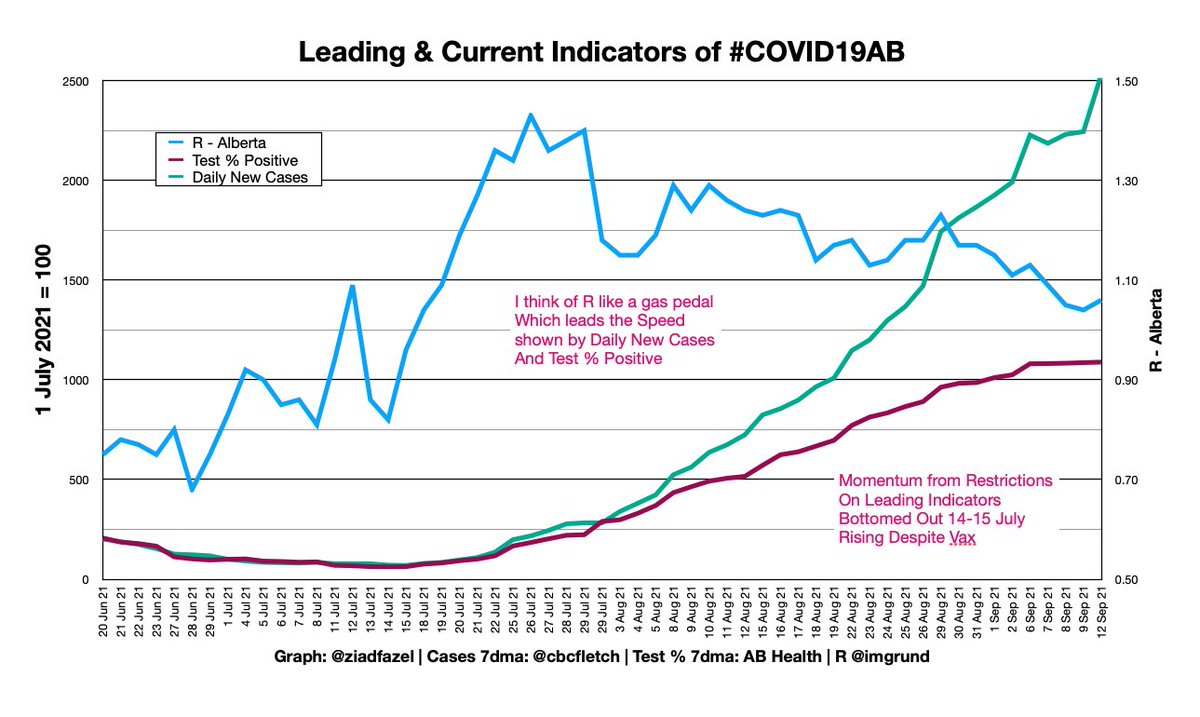
Leading indicators continue to show accelerating spread of infection.
7-day average Test Positivity 11.73% against all-time record 11.75%.
Severe Outcomes: Hospital, ICU and Death all surging faster than ever. Obviously NOT Decoupled.


Fri 9 Sep
Leading indicators continue to show accelerating spread of infection.
7-day average Test Positivity 11.73% against all-time record 11.75%.
Severe Outcomes: Hospital, ICU and Death all surging faster than ever. Obviously NOT Decoupled.


ICU Capacity taking a huge hit.
169 Albertans just with COVID-19, against total ICU capacity for all needs 173.
Look at the difference two days makes on the curve. See also comparison to AHS CEO Dr Yiu charts on 17 May 2021.


169 Albertans just with COVID-19, against total ICU capacity for all needs 173.
Look at the difference two days makes on the curve. See also comparison to AHS CEO Dr Yiu charts on 17 May 2021.


Great presentation by Sarah Mackey of @ab_vax who teaches that we can't just look at the unvaccinated as one big blob, and just write them off.
IIRC, she says we have to look at different reasons:
• Access
• Complacency
• Hesitancy
And count the removal of barriers, not 💉

IIRC, she says we have to look at different reasons:
• Access
• Complacency
• Hesitancy
And count the removal of barriers, not 💉


@ab_vax Working from AB Health's published stats, I provide this Vaccine Effectiveness by share of population.
• Fully Vax, Partly Vax, No Vax
• Hospital & ICU Case Rates
• Risk Ratio (how much lower your risk as you get your shots)
• Odds Ratio (how much worse than fully vax).


• Fully Vax, Partly Vax, No Vax
• Hospital & ICU Case Rates
• Risk Ratio (how much lower your risk as you get your shots)
• Odds Ratio (how much worse than fully vax).


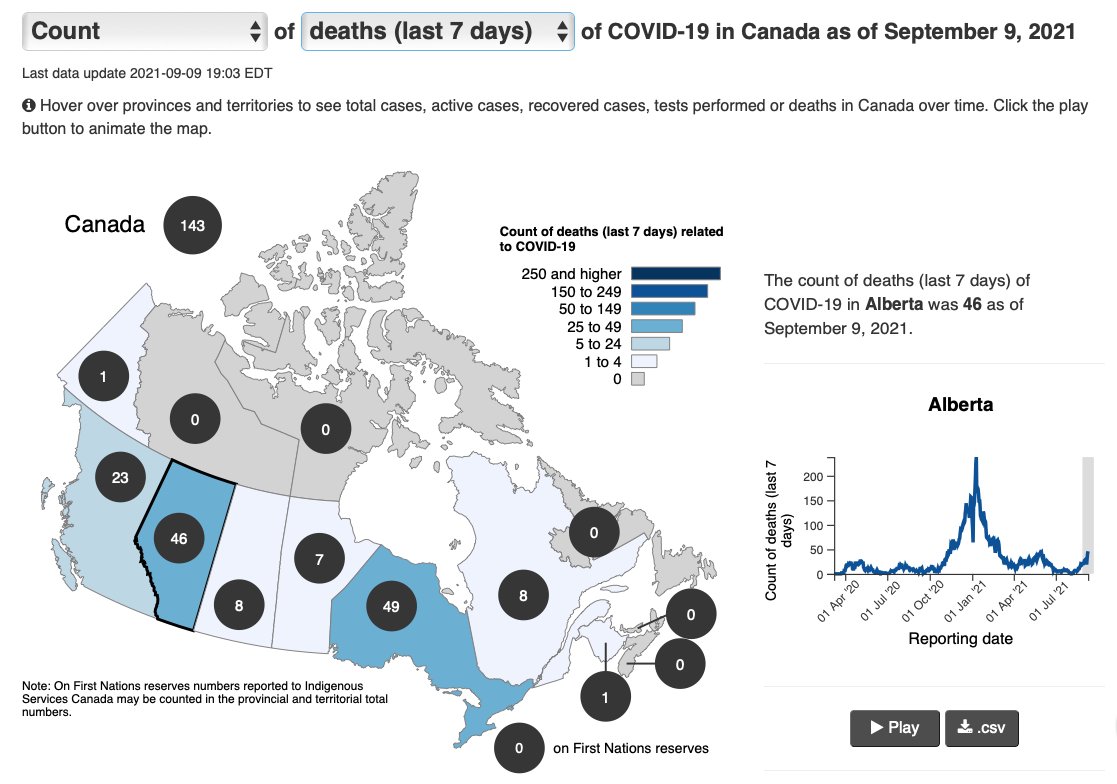
Correction: 54 Albertans died of Covid-19 in the last week, not 49 as I had shown earlier.
Tied with Ontario.
Alberta's 12% of 🇨🇦 population has 33% of the Deaths.
Revised scorecard & graphs here.
canada.ca/en/public-heal…


Tied with Ontario.
Alberta's 12% of 🇨🇦 population has 33% of the Deaths.
Revised scorecard & graphs here.
canada.ca/en/public-heal…


New graph at @ucalgaryCHI that will make Dr @FionaMattatall @DrJenGunter livid with me 🙃 if I do not mention.
"This is the number of COVID cases over the number of women who have delivered in Alberta. Both values are adjusted per 100,000 people."
covid-tracker.chi-csm.ca
"This is the number of COVID cases over the number of women who have delivered in Alberta. Both values are adjusted per 100,000 people."
covid-tracker.chi-csm.ca

Ack. Typo on the Date of my Scorecard.
Today is Friday 10 September.
Based on #COVID19AB stats published by GoA for the day ending Thursday 9 September.
Today is Friday 10 September.
Based on #COVID19AB stats published by GoA for the day ending Thursday 9 September.
Where US President Biden is referring to Republican Governors, he could have included Premier Kenney of Alberta.
Where he says “Look at the polling numbers”, please do.
angusreid.org/vaccine-passpo…
Premier Kenney’s grotesque mishandling of #COVID19AB could knock UCP out of power.
Where he says “Look at the polling numbers”, please do.
angusreid.org/vaccine-passpo…
Premier Kenney’s grotesque mishandling of #COVID19AB could knock UCP out of power.
https://twitter.com/potus/status/1436493580063936512
• • •
Missing some Tweet in this thread? You can try to
force a refresh


