Carbon Capture & Storage (CCS) in Canada.

There are two facilities (capturing in 2019), but very different stories:
* Boundary Dam: Operates ~60% capacity, used for EOR
* Quest: Operates ~90% capacity, permanent storage, but the generated H₂ is used to upgrade oilsands

1/
Boundary Dam is CCS on coal power, with the goal of capturing CO₂ for Enhanced Oil Recovery.

In short, it has not lived up to expectations. How much CO₂ gets stored is unknown, & in any case, the CO₂ is used for EOR (more CO₂).

2/

en.wikipedia.org/wiki/Boundary_…
Quest produces H₂ in a steam methane reformer, the concentrated CO₂ stream is captured & permanently stored.

Though, the H₂ is used to make heavy oil marketable, & in a sense, it is a type of EOR: the CO₂ is indirectly used to generate more CO₂.

3/

en.wikipedia.org/wiki/Quest_Car…
Figuring out storage is hard

This is Table 1.C in the UNFCCC CRF:
* The "injected" seems to be the Quest CO₂
* The bottom right number should be zero, but it is probably CO₂ for EOR
* Note that Canada also imports CO₂ from the US (for EOR).

Can anyone explain better?

4/4

• • •

Missing some Tweet in this thread? You can try to force a refresh
 

Keep Current with Glen Peters

Glen Peters Profile picture

Stay in touch and get notified when new unrolls are available from this author!

Read all threads

This Thread may be Removed Anytime!

PDF

Twitter may remove this content at anytime! Save it as PDF for later use!

Try unrolling a thread yourself!

how to unroll video
  1. Follow @ThreadReaderApp to mention us!

  2. From a Twitter thread mention us with a keyword "unroll"
@threadreaderapp unroll

Practice here first or read more on our help page!

More from @Peters_Glen

16 Sep
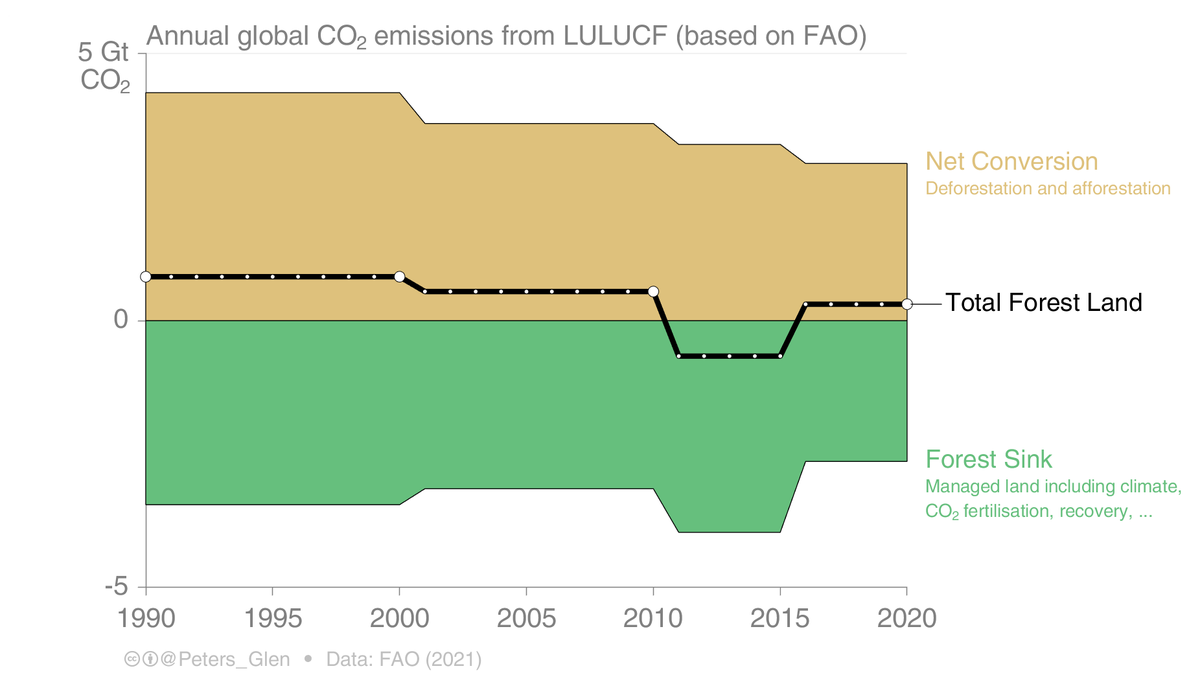
Estimating CO₂ emissions from forests is difficult, not least because of different definitions.

CO₂ emissions come from conversion (cutting down or growing a tree).

There is also a 'sink', soaking up CO₂ we previously emitted.

What should be reported as CO₂ emissions?

1/ Image
It is really rather complex. The reason the 'sink' is included in emission accounting, is that it is difficult to determine what is 'anthropogenic'.

It was decided to use self-defined 'managed land' & include 'indirect' (climate) effects.

carbonbrief.org/guest-post-cre…

2/ Image
Scientific studies (eg IPCC Assessment Reports) generally consider CO₂ emissions from 'Net Conversions' as the emissions, while government reporting to the UNFCCC combines the conversions & sink (black line).

The 'sink' is not the total sink, only a part of the forest sink.

3/ Image
Read 6 tweets
13 Sep
Norway is known for its Carbon Capture & Storage (CCS) & is best in class.

Even the best in class does not run at capacity. Currently ~80% of capacity is used, but Sleipner has dropped to ~65%.

But, Norwegian CCS is the easy type, removing CO₂ from extracted gas.

1/
The extracted gas at Sleipner Vest contains ~9% CO₂, but has to be reduced to ~2.5% to meet sales specifications.

The extracted gas in the Snøhvit field contains ~5-7.5% CO₂, and this has to be removed to avoid it freezing out in the downstream liquefaction process.

2/
The CO₂ has to be removed for market or technical reasons. You would therefore expect the facilities to run at a high capacity, as they have to!

The CO₂ is captured & stored, presumably to avoid paying the Norwegian CO₂ tax. This is great, but a different issue.

3/
Read 8 tweets
9 Sep
“[W]e scientists carry a big responsibility in not spreading the wrong messages” @jrockstrom

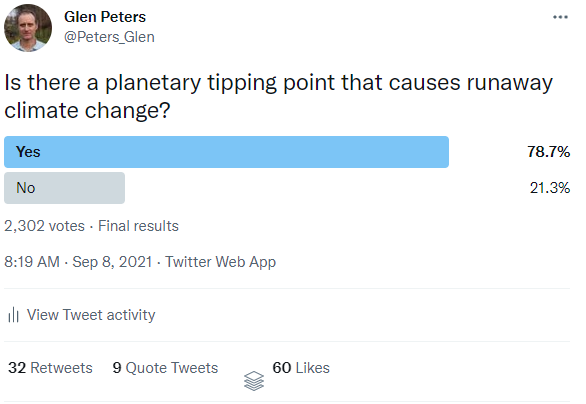
3/4 answered “yes” to this question, but Rockström said “no” in an interview with @MLiebreich

The question is ambiguous, so let’s unpack it a bit.

cleaningup.live/ep49-johan-roc…

1/
“[Y]ou're absolutely right, that nobody is suggesting that there is a planetary tipping point out there that causes runaway climate change” @jrockstrom

[I used this to make the question in the Twitter poll]

2/
That statement seems clear, but there are ambiguities:
* “a” or many?
* “planetary” or smaller scale?
* “runaway” or a new state?

These issues were common in yesterday’s discussion

3/
Read 17 tweets
8 Sep
"I accept that thanks to human activity... atmospheric CO₂ has increased from ~300ppm [to] ~400ppm, & without appropriate action, it will probably go up to 500ppm in 30-40 years, maybe sooner... I accept that that could have consequences that we would much prefer to avoid."
1/
"I absolutely accept that". For added emphasis.

"[I]t's very hard to disagree with facts, & in the end a fact is a fact is a fact. And we cannot ignore facts just because in the short term, they don't see their argument."

2/
It would seem that Tony Abbott (former Prime Minister of Australia) is quite keen on facts. And climate change is a fact, according to his own words, & action is therefore needed.

Oh, but it is China: "by far the largest source of additional emissions right now" (a fact)

3/
Read 6 tweets
1 Sep
These men were to serve one of the most important messages on the planet: “I almost fell asleep before they got to the point” @JensKjeldsen

Norwegian article on the #IPCC #WG1 Press Conference (Google Translate works) nrk.no/klima/derfor-s…

1/
“They spent a very long time talking about themselves, before they came to the decisive. They undermine both the credibility of the message and its own importance. For someone to believe what you say, they must also believe in you as a character”

2/
“They should immediately tell us what distinguishes the finding in this new report from what they already know. The significance for us. What changes we are all facing. And that we now know with much greater certainty.”

3/
Read 8 tweets
30 Aug
"[M]easurement & tracking of GHG emissions [across scales] reflect a collection of ad hoc mandates & voluntary interests"

@carbonczar & @pshepson argue to operationalise daily maps of emissions, "much like viewing daily weather"

Have a (free) read: pnas.org/content/118/35…

1/
I completely agree with nearly all their points. The current system is a mess, & their roadmap would help understand & clean up a lot of that mess.

The unclear part to me is the best end point (which such a roadmap might reveal). Do we need / want daily real-time estimates?

2/
I would suspect daily emissions will go up & down, depending on weather, traffic, events, etc. Really one wants to smooth out the daily variations to get a trend. What time period for reporting is best? Daily, weekly, monthly, annual, ...?

And at what spatial resolution?

3/
Read 5 tweets

Did Thread Reader help you today?

Support us! We are indie developers!


This site is made by just two indie developers on a laptop doing marketing, support and development! Read more about the story.

Become a Premium Member ($3/month or $30/year) and get exclusive features!

Become Premium

Too expensive? Make a small donation by buying us coffee ($5) or help with server cost ($10)

Donate via Paypal Become our Patreon

Thank you for your support!

Follow Us on Twitter!

:(