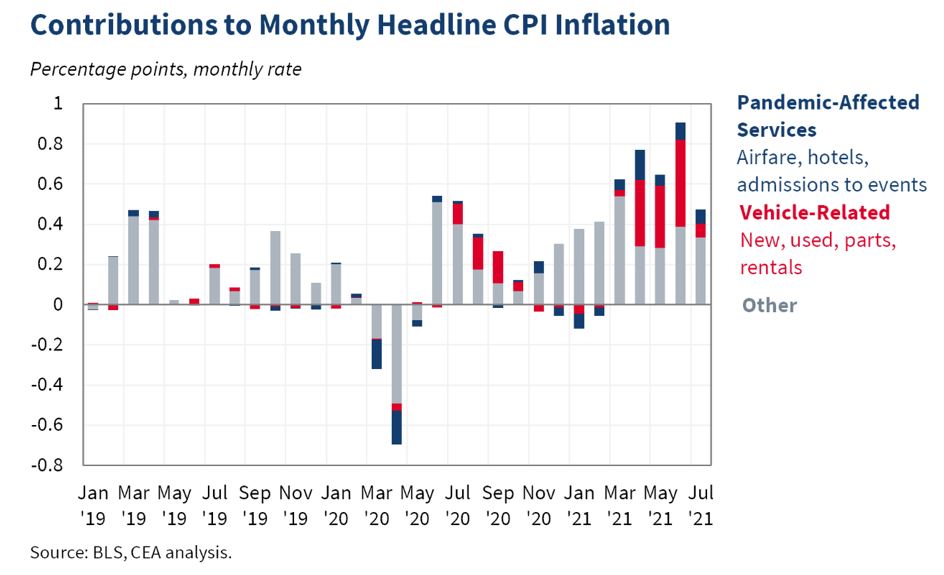
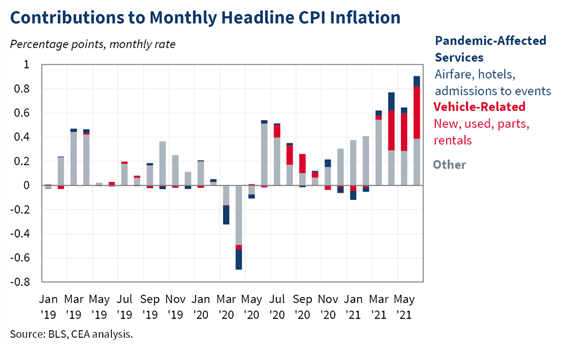
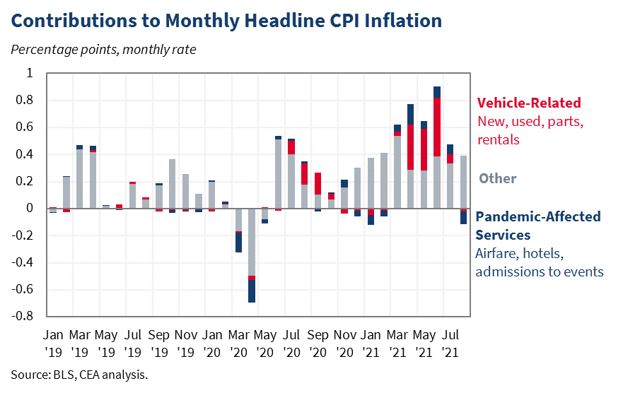
Inflation as measured by CPI increased 0.3% month-over-month in August—slightly below expectations and below July’s rate of 0.5%. The deceleration largely reflected a fall in car prices and also in pandemic-affected services. 1/
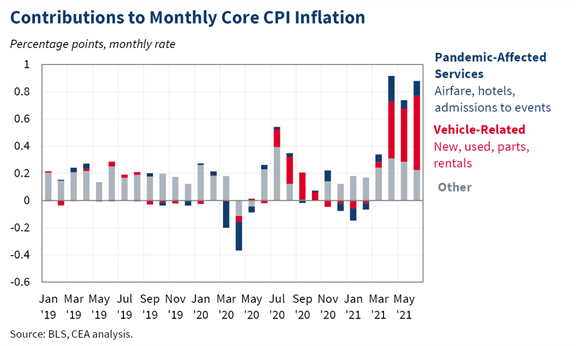
Core inflation—without food/energy—rose 0.1% month-over-month, below expectations and below July’s rate of 0.3%. 2/
Year-over-year, headline inflation rose by 5.3% while core inflation rose by 4.0%. The deceleration in the year-over-year core measure was more marked than the deceleration in the headline measure, reflecting the relatively faster price growth in food and energy. 3/
Used cars, new cars, auto parts, and car rentals together subtracted 2 basis points (functionally nil) from core month-over-month inflation, down from adding about 34 basis points on average in May, June, and July. 4/
Prices of pandemic-affected services fell this month and subtracted 12 basis points to the core inflation increase in August, relative to 9 basis points in July. The decline in this index likely reflects a change in consumer behavior due to the Delta variant. 5/
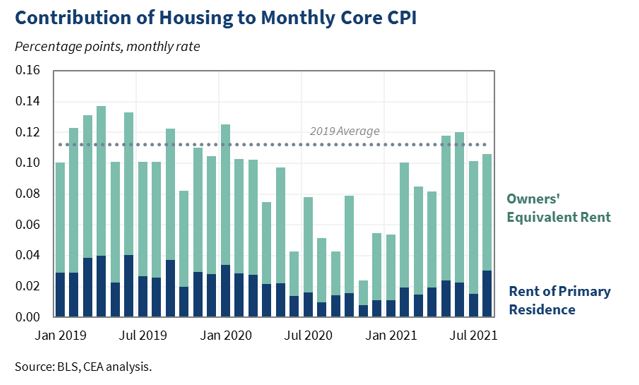
Month-over-month growth in shelter costs decelerated to a 0.2% increase in August, reflecting a price decline for lodging away from home (e.g. hotels). 6/
Price growth in owners’ equivalent rent held steady at the rate it has been in recent months, while rent for primary residence ticked up by 10 basis points. 7/
The deceleration in August is encouraging from an inflationary perspective, but continued economic disruptions from the pandemic may continue to impact inflation in months to come in either direction. 8/
In addition, even if core inflation continued at August’s rate moving forward, the year-over-year measure would remain elevated into 2022 given the higher monthly inflation seen this summer. 9/
We know that the recovery from the pandemic will not be linear. The Council of Economic Advisers will continue to monitor the data as they come in. /end
• • •
Missing some Tweet in this thread? You can try to
force a refresh
Personal income rose by 1.1% in July, a larger increase than market expectations, as compensation grew at a strong pace and government support increased due to the first monthly installment of the Child Tax Credit. 1/
Aggregate compensation (reflecting both number of employees and wages/benefits paid) grew at 0.9 percent month-over-month, a strong pace. For comparison, there were only 9 months from January 2008 to January 2020 where compensation grew at a faster pace. 2/
Government support increased over the month as Child Tax Credit payments went out, even as spending on unemployment insurance and economic impact payments decreased. 3/
The infrastructure and Build Back Better plans are designed to be long-term packages that increase the capacity of the economy through investments in physical infrastructure, human capital, clean energy, housing, and health care. 1/
Such investments, as discussed in CEA’s latest blog, should be expected to have little effect on inflationary pressures in the short-term and ease such pressures over the long term. 2/ whitehouse.gov/cea/blog/2021/…
Other factors that push against the inflationary effects of these plans include the sharp reversal of fiscal impulse, as well as the plans’ payfors. 3/
Inflation as measured by CPI increased 0.5% month-over-month in July—at expectations and below June’s rate of 0.9%. The deceleration largely reflected a lessening of price pressures from the motor vehicle sector. 1/
Core inflation—without food/energy—rose 0.3% month-over-month—below expectations and well below June’s rate of 0.9%. 2/
Year-over-year, headline inflation rose by 5.4% while core inflation rose by 4.3%. While both measures had been accelerating in recent months, year-over-year growth did not accelerate for either measure this month. 3/
Today’s report shows that growth in the U.S. economy functionally held steady for the second quarter in a row at a strong pace. The United States economy grew at 6.5 percent at an annual rate in the second quarter of 2021. 1/
The level of real GDP is finally above its pre-pandemic level as the economy has experienced its fastest growth in the first half of the year since 1984. 2/
As consumers increasingly bought services, consumption of services contributed 5.1 percentage points to GDP. This is the most service consumption has ever contributed to GDP, except for the pandemic bounce back in 2020Q3. 3/
Inflation as measured by CPI increased at a 5.4% rate year-over-year last month and 0.9% month-over-month. Core inflation—without food/energy—rose 4.5% year-over-year and 0.9% month-over-month. A large part of the increase is due to cars and pandemic-affected services. 1/
Cars once again accounted for a large share of the increase. Used cars, new cars, auto parts, and car rentals together made up about 60 percent of core month-over-month inflation 2/
Prices of pandemic-affected services rose again this month and contributed 11 basis points to the core inflation increase in June. 3/
New from CEA: we examine previous periods of heightened inflation and see what they can teach us about inflation in 2021. 1/ whitehouse.gov/cea/blog/2021/…
Since World War II, there have been six periods in which inflation—as measured by CPI—was 5 percent or higher: 1946–48, 1950–51, 1969–71, 1973–82, and 2008. 2/
The three most recent inflationary episodes were largely a function of oil shocks; in contrast, pandemic price dynamics have not been primarily driven by oil supply, though we continue to closely monitor ongoing energy price behavior. 3/