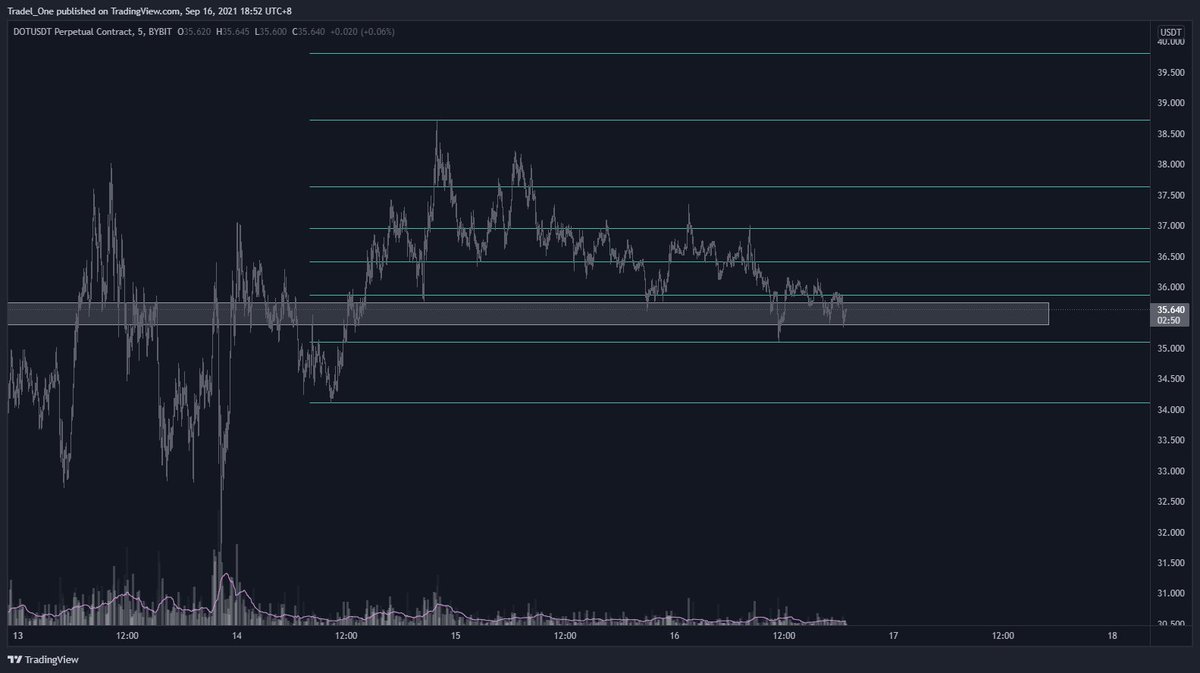
A little snippet into a current trade of mine right now - $DOT
A mini day trade thread:
- First open the chart and assess the Price Action
- What we see is some previous market structure broken per the rectangle
- We've also now had 4 taps of support here
A mini day trade thread:
- First open the chart and assess the Price Action
- What we see is some previous market structure broken per the rectangle
- We've also now had 4 taps of support here

Now we set up our HTF fibs as shown, and then also check the volume
- Note that there was a large amount of volume to support the larger move, with much lower volume now where price is trading
- Note that there was a large amount of volume to support the larger move, with much lower volume now where price is trading

Then we add our fibs on to suit as we love to do
Followed by our mate, Stochastic RSI
- Old mate SRSI shows us that there is an overbought event right now occuring at the resistance of the 0.618 level
- This suggests that the market will dip as a result
- I'm now set up for a short sell
- But, let's look for more confluence
- Old mate SRSI shows us that there is an overbought event right now occuring at the resistance of the 0.618 level
- This suggests that the market will dip as a result
- I'm now set up for a short sell
- But, let's look for more confluence

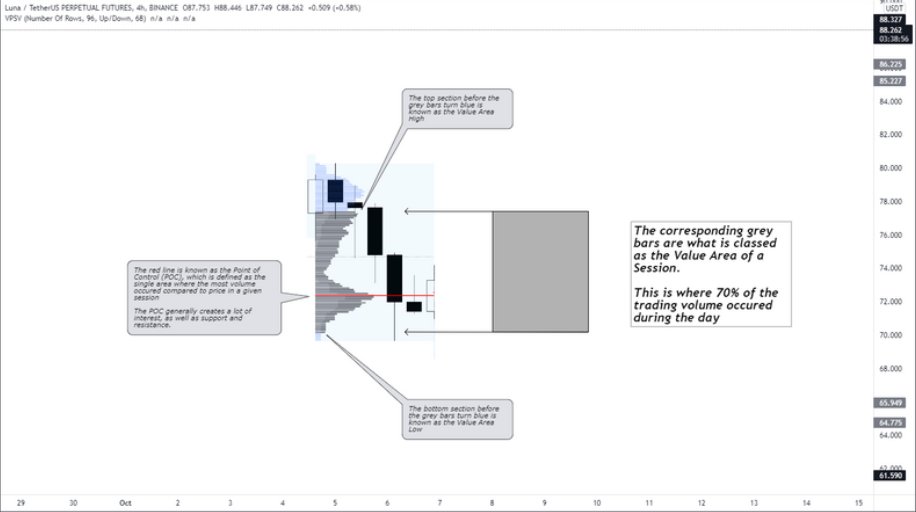
So for more confluence, let's take a look at the VPVR
And, what do you know - a point of control also sits right on the fib that price is resisting at, coupled with the overbought SRSI, and... one more thing
Our bias builds for a short.
And, what do you know - a point of control also sits right on the fib that price is resisting at, coupled with the overbought SRSI, and... one more thing
Our bias builds for a short.

We now also pull our fibs with our targets, and price also lines up with the 0.618 to 0.705 level for an entry, and target could be the 0.786 fib which is also not far from the Value Area Low of the VPVR we explored above.
Short confirmed
Short confirmed

By this time, I've taken first profits, and my SL is now at break even.
It only takes 5 mins to assess a trade, and when you find the conviction that supports your idea, pull the trigger.
Take no prisoners.
You're right or your wrong, but probability is in your favour here.
It only takes 5 mins to assess a trade, and when you find the conviction that supports your idea, pull the trigger.
Take no prisoners.
You're right or your wrong, but probability is in your favour here.
And for those of you who were playing at home, here is the result of our daytrade that we took.
Target hit for 2.53R
Remember:
- Build the narrative
- Find the confluence
- Execute
- Repeat
You can do this!
Target hit for 2.53R
Remember:
- Build the narrative
- Find the confluence
- Execute
- Repeat
You can do this!

• • •
Missing some Tweet in this thread? You can try to
force a refresh