STEP 5: Do this for the sectors that are included in the #NIFTY500. There will be around 20 major sectors.
You can modify the stocks and put them into different watchlists according to your preference. For example: All the #Banking stocks are included in #FinancialServices.
There are some things that you need to keep in mind. This is a very tedious process, but if you cannot afford or don't need the resources for the paid version, this is your best available alternative.
Hope I added some value to your trading journey in this thread.
Thank You!
[Note: You have to add the following stocks manually] 1. BAJAJ AUTO 2. L&T HOUSING FINANCE 3. M&M FINANCE 4. MAHINDRA & MAHINDRA 5. NIPPON ASSET MANAGEMENT INDIA
6 UNITED SPIRITS
The 52-week index filter on @screener_in is one of the most effective ways to filter out stocks for #equity segment.
Here's how it can help you 👇
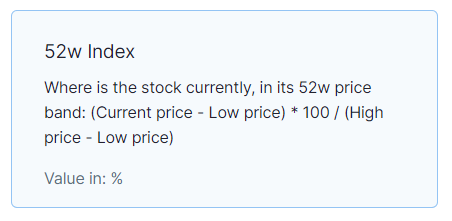
1/ The 52-week index is simply a stock in its 52-week band.
The formula is:
(𝘊𝘶𝘳𝘳𝘦𝘯𝘵 𝘱𝘳𝘪𝘤𝘦 - 𝘓𝘰𝘸 𝘱𝘳𝘪𝘤𝘦) * 100 / (𝘏𝘪𝘨𝘩 𝘱𝘳𝘪𝘤𝘦 - 𝘓𝘰𝘸 𝘱𝘳𝘪𝘤𝘦)
𝗩𝗮𝗹𝘂𝗲 𝗶𝗻 %
2/ Now you may ask what is the 𝟱𝟮-𝘄𝗲𝗲𝗸 𝗯𝗮𝗻𝗱?
Lets understand this with an example -
Take this example of #Birlasoft.
Current Price= ₹531
52-Week High= ₹538
52-Low= ₹216
So, its 𝟱𝟮-𝘄𝗲𝗲𝗸 𝗯𝗮𝗻𝗱 comes at -
= (531-216)/(538-216)*100
= 97.5%
1/
Volatility Contraction Pattern (VCP) as laid out by @markminervini is a contraction in price and volume of a security in its simplest meaning.
Some people think that making a few curves makes a VCP. This idea of VCP is so wrong that the pattern loses it's true essence.
2/
Allow me to explain -
A VCP is not a holy-grail pattern. A VCP has the same characteristics to a Cup & Handle, Inverse H&S, Triangles, Rectangles, among many others.
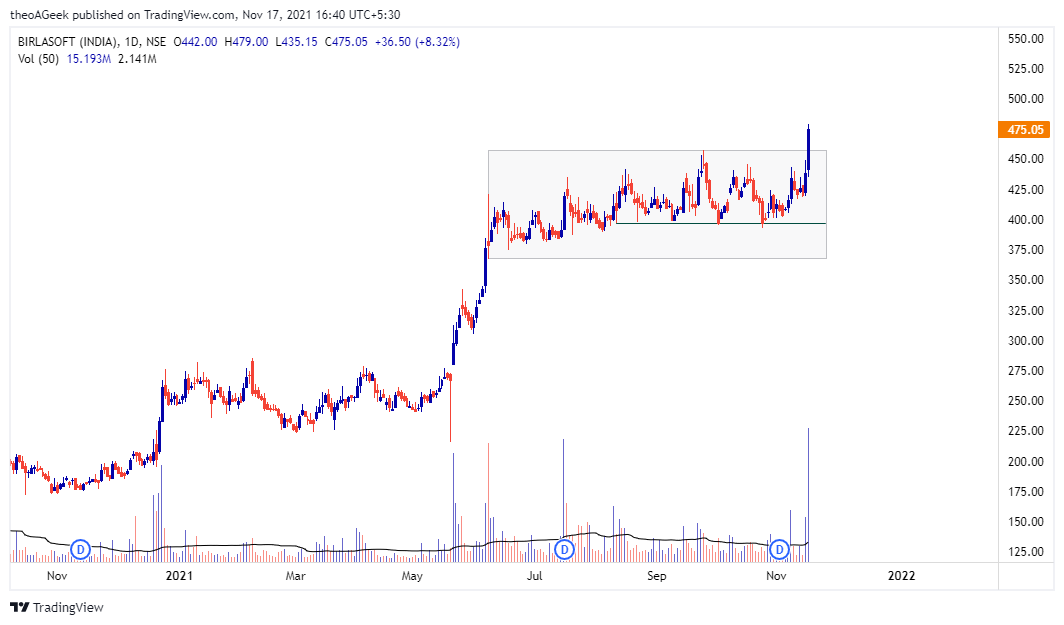
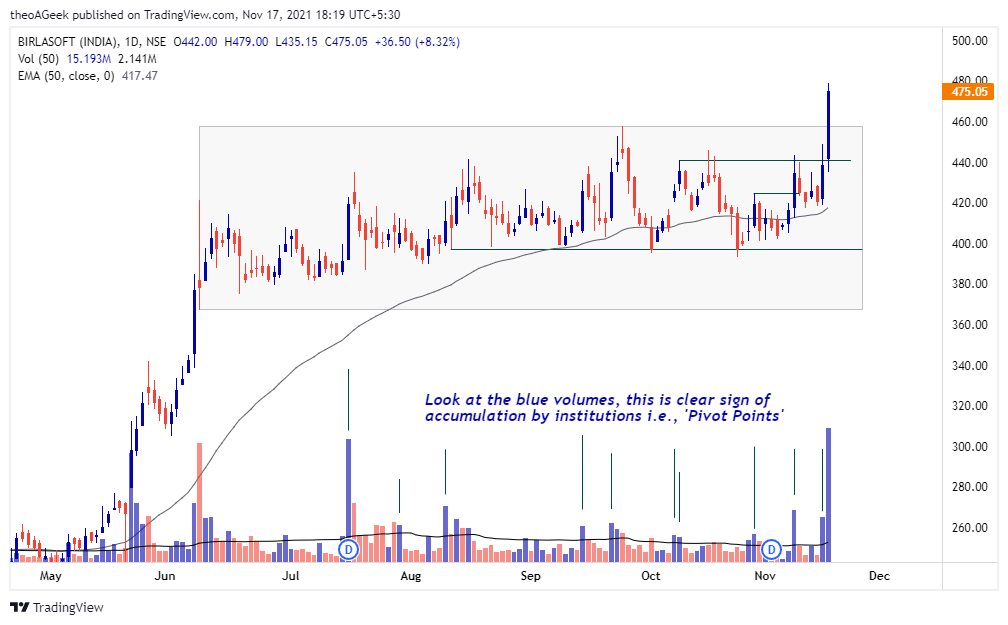
1/ Price was stuck in a range for a long time after a good advance. Now, when I saw the chart for the first time I thought that maybe distribution was going on, in the overall context of the trend.
But, upon closer look I found something interesting.
2/ Look at the price and volume relationship, whenever price was heading higher, volumes were mostly above average.
Now, I was beginning to think that maybe it was not a distribution phase, but re-accumulation.
1/ One of the most important aspect of making it big as a trader is to learn the art of 'betting big'. Virtually every single superstar trader/investor we have heard of has at some point of time in their careers bet big on their best ideas.
2/ What do George Soros, William O'Neil, Warren Buffett, Paul Tudor Jones, Jesse Livermore, Bruce Kovner, and @markminervini have in common? They all knew and practiced the art of the big bet. They are/were masters of the big bet-in respect to betting big on their best ideas.
1/ A trading journal is a log of all your trading activities.
Now this begs the question, why journal your trades?
✅A journal helps you to monitor both the performance of your trading system and your ability to execute it with consistency.
2/ When kept right, your trading journal becomes an invaluable reference manual that can help you recall both what you’ve done right and what you’ve done wrong in the past, thus keeping you on the right track moving forward and preventing the same mistakes again in the future.
1/
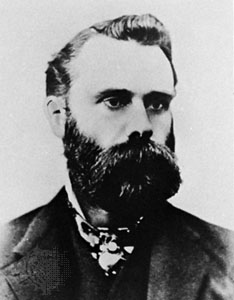
Dow Theory was introduced to the world by Charles H. Dow, who also founded the Dow-Jones financial news service (Wall Street Journal).
The Dow Theory forms an important part of technical analysis.
2/ The principles of Dow Theory help traders understand the market better and identify price and volume movements accurately. The Dow Theory primarily helps traders identify market trends with great accuracy, so they can take advantage of potential price action points.