1/
Get a cup of coffee.
In this thread, I'll show you how to *correctly* calculate inflation-adjusted investment returns.
Here's the punch line: the *naive* procedure that many people use (ie, Real Return = Nominal Return minus Inflation) is not exactly correct.
Get a cup of coffee.
In this thread, I'll show you how to *correctly* calculate inflation-adjusted investment returns.
Here's the punch line: the *naive* procedure that many people use (ie, Real Return = Nominal Return minus Inflation) is not exactly correct.

2/
Imagine 2 scenarios.
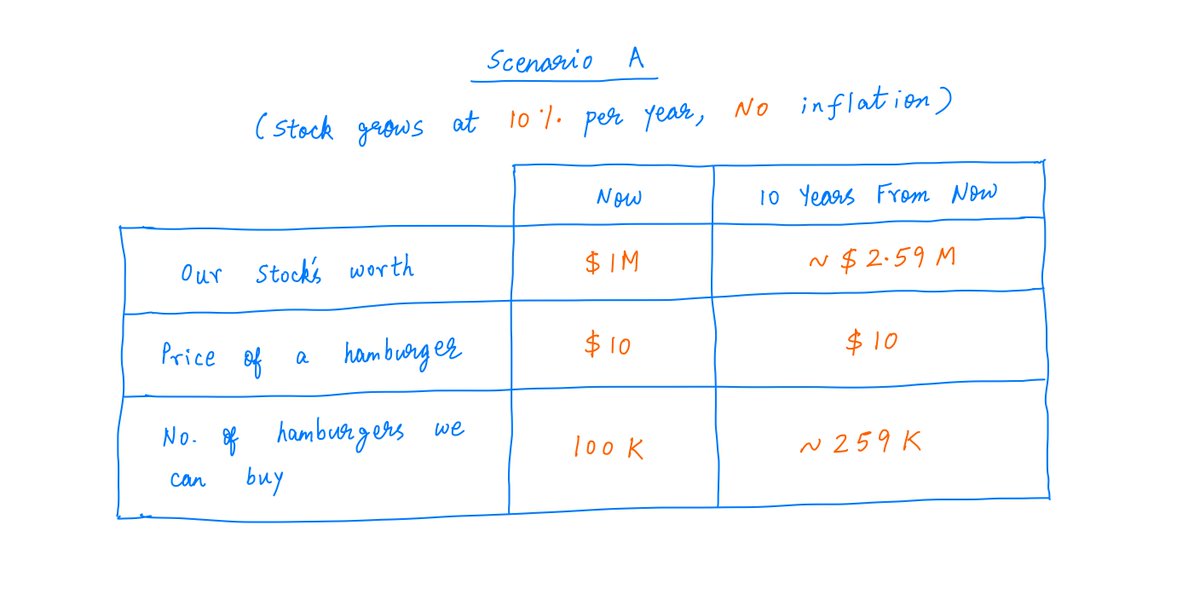
Scenario A. We buy a stock. It grows at 10% per year over the next 10 years. During this time, there's NO inflation.
Scenario B. Our stock grows at *15%* per year over the same 10 years. But during this time, inflation runs at 5% per year.
Imagine 2 scenarios.
Scenario A. We buy a stock. It grows at 10% per year over the next 10 years. During this time, there's NO inflation.
Scenario B. Our stock grows at *15%* per year over the same 10 years. But during this time, inflation runs at 5% per year.
3/
The question is: are we better off in Scenario A or Scenario B?
Or, are they both the same? After all, in both scenarios, if we back out inflation from the stock's growth, we get the same result: 10% - 0% = 15% - 5% = 10%.
What do you think?
The question is: are we better off in Scenario A or Scenario B?
Or, are they both the same? After all, in both scenarios, if we back out inflation from the stock's growth, we get the same result: 10% - 0% = 15% - 5% = 10%.
What do you think?
4/
In his 1980 Berkshire letter, Warren Buffett proposed a simple way to account for inflation while measuring investment returns.
I like to call this the "hamburger test". 👇
In his 1980 Berkshire letter, Warren Buffett proposed a simple way to account for inflation while measuring investment returns.
I like to call this the "hamburger test". 👇

5/
It's common sense.
Suppose we make an investment.
And as a result, our "hamburger buying" power increases over time.
How fast does it increase? How many more hamburgers can we buy in the future compared to today?
That's our *real* return from making the investment.
It's common sense.
Suppose we make an investment.
And as a result, our "hamburger buying" power increases over time.
How fast does it increase? How many more hamburgers can we buy in the future compared to today?
That's our *real* return from making the investment.
6/
Let's apply this hamburger test to Scenarios A and B above.
In both scenarios, let's say we buy $1M worth of stock.
And let's say a hamburger costs $10 today.
So, with our $1M, we *could have* bought 100K hamburgers.
But instead, we bought the stock.
Let's apply this hamburger test to Scenarios A and B above.
In both scenarios, let's say we buy $1M worth of stock.
And let's say a hamburger costs $10 today.
So, with our $1M, we *could have* bought 100K hamburgers.
But instead, we bought the stock.
7/
In Scenario A, our stock grows at 10% per year.
So, after 10 years, our $1M turns into $1M * (1.1^10) = ~$2.59M.
There's NO inflation in this scenario.
So, after 10 years, hamburgers still cost $10 apiece.
That means, after 10 years, we can buy ~259K hamburgers.
In Scenario A, our stock grows at 10% per year.
So, after 10 years, our $1M turns into $1M * (1.1^10) = ~$2.59M.
There's NO inflation in this scenario.
So, after 10 years, hamburgers still cost $10 apiece.
That means, after 10 years, we can buy ~259K hamburgers.
8/
What about Scenario B?
Here, our stock grows at *15%*/year. So, after 10 years, our $1M turns into $1M * (1.15^10) = ~$4.05M.
But there's 5% inflation per year.
So, after 10 years, hamburgers cost $10 * (1.05^10) = ~$16.29 apiece.
Our ~$4.05M will buy us ~248K hamburgers.
What about Scenario B?
Here, our stock grows at *15%*/year. So, after 10 years, our $1M turns into $1M * (1.15^10) = ~$4.05M.
But there's 5% inflation per year.
So, after 10 years, hamburgers cost $10 * (1.05^10) = ~$16.29 apiece.
Our ~$4.05M will buy us ~248K hamburgers.

9/
So, after 10 years, this is our "hamburger buying" power:
Scenario A: ~259K hamburgers
Scenario B: ~248K hamburgers
Therefore, Scenario A is clearly better.
So, after 10 years, this is our "hamburger buying" power:
Scenario A: ~259K hamburgers
Scenario B: ~248K hamburgers
Therefore, Scenario A is clearly better.
10/
Usually, people account for inflation by just subtracting it from nominal returns.
If a stock returns 15% per year during a period of 5% inflation, the *real* return from the stock is usually calculated as 15% - 5% = 10% per year.
I call this the Naive Subtraction method.
Usually, people account for inflation by just subtracting it from nominal returns.
If a stock returns 15% per year during a period of 5% inflation, the *real* return from the stock is usually calculated as 15% - 5% = 10% per year.
I call this the Naive Subtraction method.
11/
Under the Naive Subtraction method, there's no difference between Scenarios A and B.
But the hamburger test clearly refutes this.
In Scenario A, our "hamburger buying" power grows at 10% per year. In Scenario B, it's only ~9.52% per year.
A is definitely better!
Under the Naive Subtraction method, there's no difference between Scenarios A and B.
But the hamburger test clearly refutes this.
In Scenario A, our "hamburger buying" power grows at 10% per year. In Scenario B, it's only ~9.52% per year.
A is definitely better!
12/
Here are the formulas for calculating inflation-adjusted returns using both Naive Subtraction and the Hamburger Method -- along with a couple examples.
Naive Subtraction is only a quick approximation. It's not exactly right.
The Hamburger Method is the correct way.
Here are the formulas for calculating inflation-adjusted returns using both Naive Subtraction and the Hamburger Method -- along with a couple examples.
Naive Subtraction is only a quick approximation. It's not exactly right.
The Hamburger Method is the correct way.


13/
And here's a matrix that shows when Naive Subtraction {over, correctly, under}-estimates real returns.
For example, in the most common situation -- where inflation is positive, and nominal returns exceed inflation -- Naive Subtraction *over-estimates* real returns.
And here's a matrix that shows when Naive Subtraction {over, correctly, under}-estimates real returns.
For example, in the most common situation -- where inflation is positive, and nominal returns exceed inflation -- Naive Subtraction *over-estimates* real returns.

14/
The same principles can be used to correctly perform inflation-adjusted Discounted Cash Flow (DCF) and Internal Rate of Return (IRR) calculations.
In these calculations too, Naive Subtraction produces different results compared to the Hamburger Method.
The same principles can be used to correctly perform inflation-adjusted Discounted Cash Flow (DCF) and Internal Rate of Return (IRR) calculations.
In these calculations too, Naive Subtraction produces different results compared to the Hamburger Method.
15/
For example, suppose we have a business that will return $1M to us after 1 year.
And suppose this $1M will grow at 10% per year for the next 9 years.
And after that, it will grow at 3% per year.
Like so:
For example, suppose we have a business that will return $1M to us after 1 year.
And suppose this $1M will grow at 10% per year for the next 9 years.
And after that, it will grow at 3% per year.
Like so:

16/
Suppose we estimate that inflation will run at ~3% per year -- forever into the future.
And suppose we want a 12% *real* (ie, inflation-adjusted) return from buying this business.
The question is: how much can we pay for the business?
Suppose we estimate that inflation will run at ~3% per year -- forever into the future.
And suppose we want a 12% *real* (ie, inflation-adjusted) return from buying this business.
The question is: how much can we pay for the business?
17/
Naive Subtraction will approach the question this way.
Inflation = 3% per year.
Real Return desired = 12% per year.
Real Return = Nominal Return - Inflation
So, our Nominal Return must be 15% per year.
Naive Subtraction will approach the question this way.
Inflation = 3% per year.
Real Return desired = 12% per year.
Real Return = Nominal Return - Inflation
So, our Nominal Return must be 15% per year.
18/
So, if we simply take the future cash flows of the business and discount them to today, using a 15% per year discount rate, we'll get the price we can pay to acquire the business.
This works out to about ~$12.18M. 👇
So, if we simply take the future cash flows of the business and discount them to today, using a 15% per year discount rate, we'll get the price we can pay to acquire the business.
This works out to about ~$12.18M. 👇

19/
The Hamburger Method does things differently.
First, it converts all future cash flows into future hamburgers -- at future prices.
Then, it discounts these future hamburgers to the present -- using our desired real rate of return (12% per year) as the discount rate.
The Hamburger Method does things differently.
First, it converts all future cash flows into future hamburgers -- at future prices.
Then, it discounts these future hamburgers to the present -- using our desired real rate of return (12% per year) as the discount rate.
20/
This tells us how many hamburgers we can forego consuming today -- in order to acquire the business.
And multiplying this by how much a hamburger costs today tells us how much we can pay for the business.
This works out to ~$11.77M. 👇
This tells us how many hamburgers we can forego consuming today -- in order to acquire the business.
And multiplying this by how much a hamburger costs today tells us how much we can pay for the business.
This works out to ~$11.77M. 👇

21/
Thus, Naive Subtraction *over-estimates* what we can pay for the business by about ~3.5%.
That's if we assume 3% per year inflation.
The discrepancy widens as inflation increases. For example, at 8% inflation, the over-estimation due to Naive Subtraction is ~6.7%.
Thus, Naive Subtraction *over-estimates* what we can pay for the business by about ~3.5%.
That's if we assume 3% per year inflation.
The discrepancy widens as inflation increases. For example, at 8% inflation, the over-estimation due to Naive Subtraction is ~6.7%.
22/
Key lesson:
Many widely used practices in finance and investing -- like inflation adjustment via Naive Subtraction -- are just approximations.
It's a good idea to learn the core concepts behind these approximations from first principles -- eg, via the Hamburger Method.
Key lesson:
Many widely used practices in finance and investing -- like inflation adjustment via Naive Subtraction -- are just approximations.
It's a good idea to learn the core concepts behind these approximations from first principles -- eg, via the Hamburger Method.
23/
Deriving everything we can from first principles is a good habit.
It keeps our thinking sharp and clear.
And it helps us recognize the hidden assumptions and pitfalls associated with common practices (like Naive Subtraction) that we normally just take for granted.
Deriving everything we can from first principles is a good habit.
It keeps our thinking sharp and clear.
And it helps us recognize the hidden assumptions and pitfalls associated with common practices (like Naive Subtraction) that we normally just take for granted.
24/
If you're still with me, thank you very much!
I hope this thread helped you appreciate the rich nuance behind even seemingly simple investing concepts -- like adjusting cash flows/returns for inflation.
Please stay safe. Enjoy your weekend!
/End
If you're still with me, thank you very much!
I hope this thread helped you appreciate the rich nuance behind even seemingly simple investing concepts -- like adjusting cash flows/returns for inflation.
Please stay safe. Enjoy your weekend!
/End
• • •
Missing some Tweet in this thread? You can try to
force a refresh