Alt Chart Analysis

1. #ATOM
Good support at $30 zone
Next Levels which can be seen are $47 / $56

(#BTC should be rangebound for #ATOM to keep moving up)

Can trade #ATOM perp on @Delta_Exchange
delta.exchange/CryptoAce Image
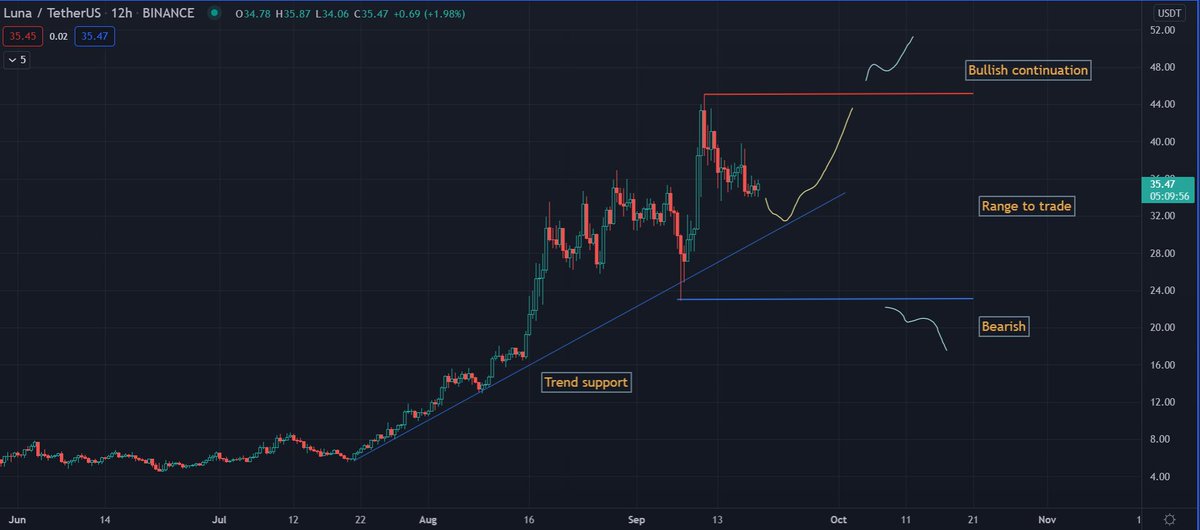
2. #LUNA moving in good uptrend
If $30-$32 level shows support can be good swing long for $42 level

As of now $45 and $22 are major resistance and support
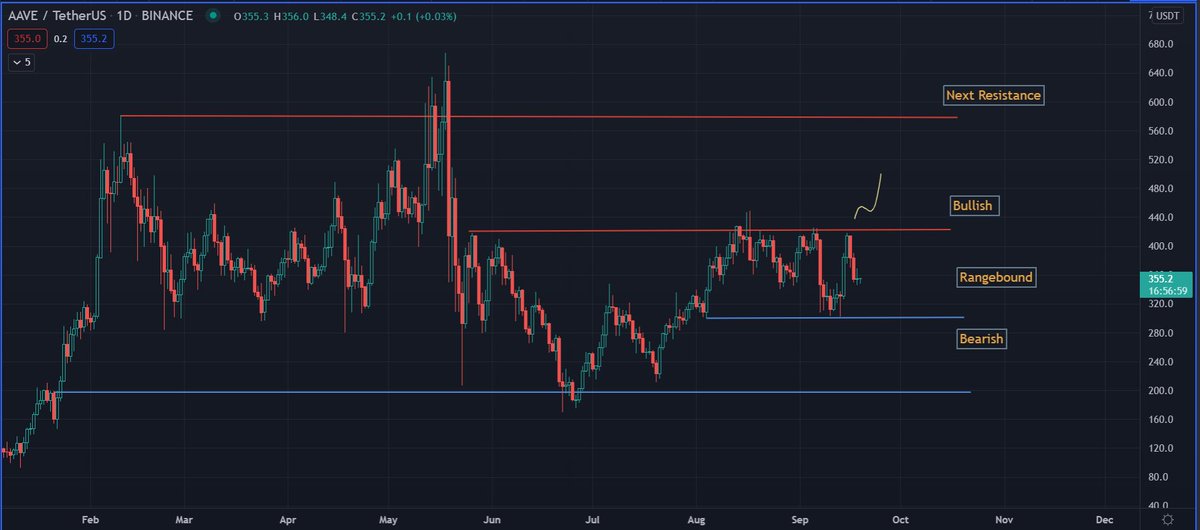
 Image
#AAVE still in range
Need to break above $425 decisively for bullish continuation towards $575 level
Support at $300 level should hold for uptrend
Will wait for breakout/breakdown to trade Image
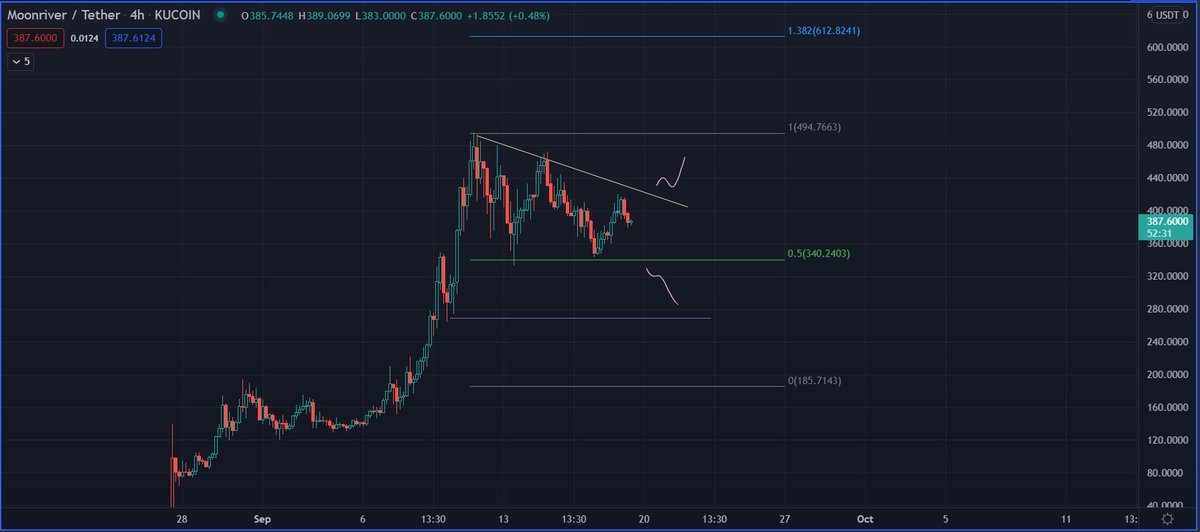
#MOVR possible bullish pennant in formation
Buying on breakout would be safer bet here,
$340 seems to be good support as of now

Breakout can give $500/$620 targets Image
#ADA analysis shared few days back, still sideways

• • •

Missing some Tweet in this thread? You can try to force a refresh
 

Keep Current with CryptoAce

CryptoAce Profile picture

Stay in touch and get notified when new unrolls are available from this author!

Read all threads

This Thread may be Removed Anytime!

PDF

Twitter may remove this content at anytime! Save it as PDF for later use!

Try unrolling a thread yourself!

how to unroll video
  1. Follow @ThreadReaderApp to mention us!

  2. From a Twitter thread mention us with a keyword "unroll"
@threadreaderapp unroll

Practice here first or read more on our help page!

More from @CryptoAceBTC

27 Jul
📔 List of All Educational and Learning threads 📔

Listing below all threads written on educational content or tips shared from time to time.

1.
V Bottom Pattern
Read 7 tweets
24 Apr
#BTC Long term Chart Analysis and views
1/n #Bitcoin is becoming mainstream asset and moving towards stability with respect to price. Adoption will keep on increasing no doubt. Looking at the price movement it seems price is slowing down with respect to time.
2/n Any of the last two tops are not reaching the previous resistance line. This indicates price is moving slow.
On long term basis it is expected to go beyond $150k-$200k. In my opinion Buying #BTC is best near the Blue curve as that is long term support.
3/n From one Bottom to Top gains have been reducing for #BTC. This can indicate Adoption is reaching saturation for #Bitcoin.
Looking at Lows, one low didnt go below previous top. This indicates more long term HODLers. which is good for price as supply is reducing over YOY basis
Read 6 tweets
21 Apr
#ETH RSI on long term Resistance. Last time it was at 3D resistance and we saw the big drop. Now it is on weekly chart, big downside if weekly close below trendline
Short on #ETH above 2430 will add in parts. Any spike upside is expected to be sold
Stops above 2680
#RedMAY Image
#ETH down from 2460 to 2320.
Resistance is strong, dont ape in longs.
Possibly there can be a spike to 2500 but not expected to sustain.
BTC is not supporting at all.
Added 2nd part of short 2530. Planned shorts in 3 parts over days. Average 2470
If anything goes wrong will close these 2 parts itself or will add 3rd part on confirmation.
By weekly close prices should come down again.
Read 7 tweets

Did Thread Reader help you today?

Support us! We are indie developers!


This site is made by just two indie developers on a laptop doing marketing, support and development! Read more about the story.

Become a Premium Member ($3/month or $30/year) and get exclusive features!

Become Premium

Too expensive? Make a small donation by buying us coffee ($5) or help with server cost ($10)

Donate via Paypal Become our Patreon

Thank you for your support!

Follow Us on Twitter!

:(