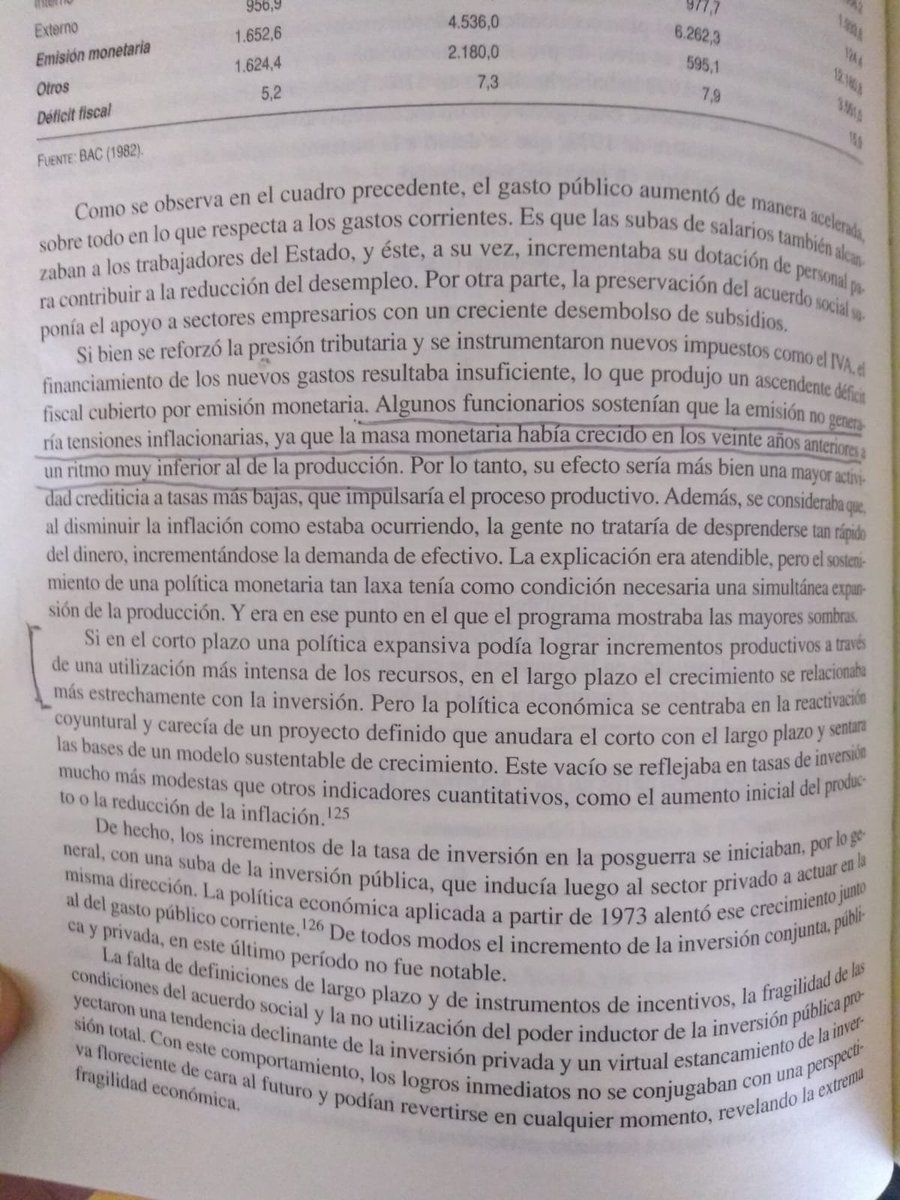
Hilo 1- parte de la antesala del #rodrigazo fue la caida de las materias primas que exportamos y el aumento de la energia q importabamos te suena? mira este ratio mientras mas aumenta la energia con respecto a los alimentos, mas cae.Te dejo un fragmento de un libro Mario Rapoport
2-
3-
4-

• • •

Missing some Tweet in this thread? You can try to force a refresh
 

Keep Current with Francisco mercado

Francisco mercado Profile picture

Stay in touch and get notified when new unrolls are available from this author!

Read all threads

This Thread may be Removed Anytime!

PDF

Twitter may remove this content at anytime! Save it as PDF for later use!

Try unrolling a thread yourself!

how to unroll video
  1. Follow @ThreadReaderApp to mention us!

  2. From a Twitter thread mention us with a keyword "unroll"
@threadreaderapp unroll

Practice here first or read more on our help page!

More from @franciscocapde8

15 Mar
1-Realized Cap values different part of the supplies at different prices (instead of using the current daily close). Specifically, it is computed by valuing each UTXO (Unspent transaction output) by the price when it was last moved. Image
2-in plain english its like financial cap or all real money destinated to buy each coin. In retrospective MARKET CAP is more known (all coins in existence times de value of btc) but this isnt the real Money that come in to the space of btc, realizad cap is a better measure for it
3- The diference between r.cap and mkt cap is the profit of all the Holders given in the way they were bought in time and price. Looking at the graph we see less amount of money that flows in the mkt makes the price move faster,
Read 7 tweets
23 Feb
THREAD1-gdp measured against m2 is the velocity of money. This measures inflation or deflation, velocity spikes when gdp grow faster than m2, people run off money because rising prices, we are going to apply this comparison against other asset (btc, gold,dow j.) instead of GDP
2-as u can see in the previous chart since 00´s the veloc. wont stop from falling, this is deflation in GDP in the real economy, thats because m2 rise faster than gdp can grow, so where is all that money going? will see
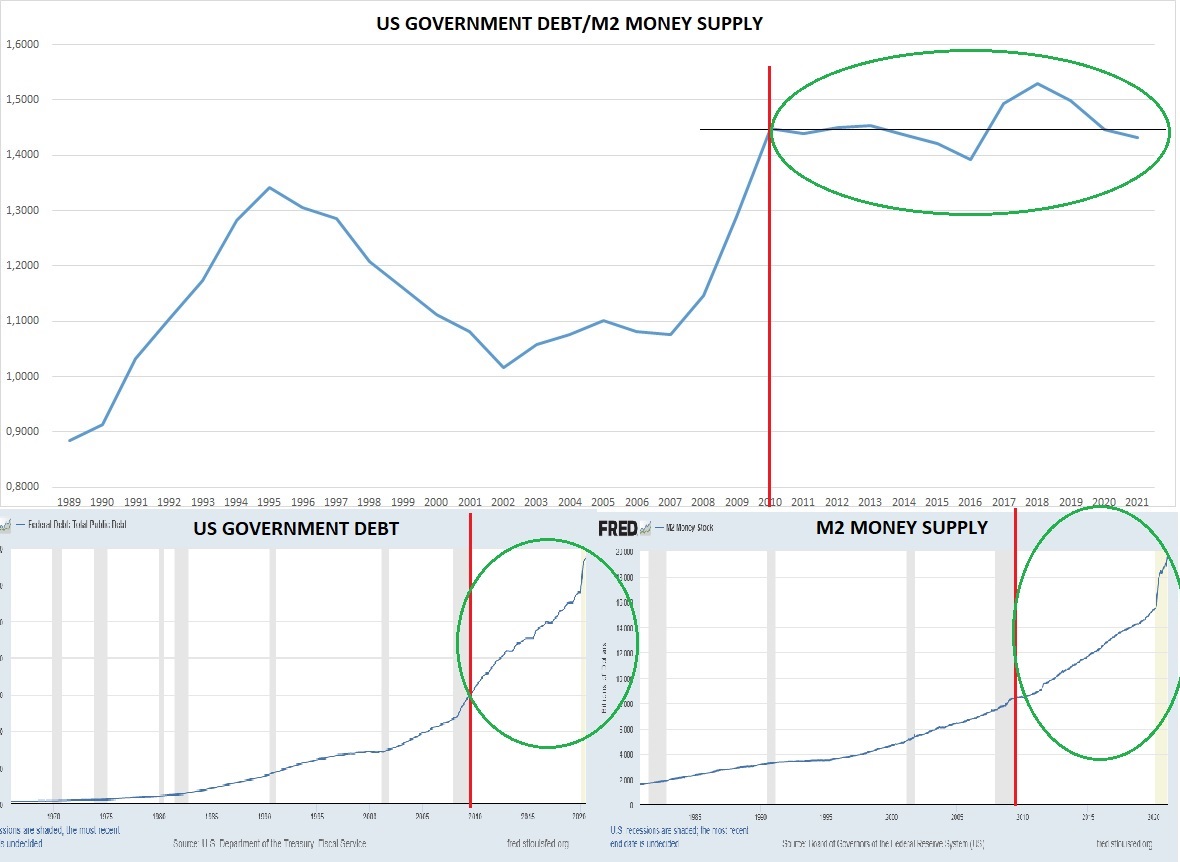
3-two charts gov.debt and m2, you can calculate the velocity of debt as in the past graph you got the velocity of money in the economy. see the las 10 years a sideways patern and stop from rising, means that debt colocation is less against m2 printing machine.
Read 9 tweets
23 Feb
thread1-2008 broke the trendline, this means that money supply increase faster and higher than gdp can grow. You can also see brown line entering in a down patern with lower highs. this is because money isnt going to real economy but going to bonds and stocks and other spec. as.
thread2-If FED is injecting 100 usd to get 100 usd or less growth in gdp, it means that economy is not getting real growth is a zero sum game, thats why you can see the decouple of the brown line since 2008, meaning new printed dollars doesnt make a real growth in usd terms
Thread3- here u can see that money printing is getting parabolic while gdp is rising in a constant trend, showing that you need more dollars to get the same constant growth.
Read 11 tweets

Did Thread Reader help you today?

Support us! We are indie developers!


This site is made by just two indie developers on a laptop doing marketing, support and development! Read more about the story.

Become a Premium Member ($3/month or $30/year) and get exclusive features!

Become Premium

Too expensive? Make a small donation by buying us coffee ($5) or help with server cost ($10)

Donate via Paypal Become our Patreon

Thank you for your support!

Follow Us on Twitter!

:(