This thread explores how time confouding can artificially inflate vaccine effectiveness (VE) estimates from observational data & make them misleading.

This may explain some reports earlier this year reporting 97-98%+ VE numbers, too high to be believable.
1/n
The basic idea is:
1. Vaccination rates were very low in early 2021
2. COVID-19 infection/death rates were very high in early 2021 from winter surge
2/n
3. Vaccination rates strongly increased moving from winter into spring/early summer 2021
4. COVID infection/death rates decreased moving from winter into spring/early summer coming off the winter surge and into the pre-Delta lull.
3/n
From this, we see that a confounder (time) was strongly positively associated with exposure (vaccination) and strongly negatively associated with the outcome (COVID-19 cases/deaths).
4/n
This confounding can cause a Simpson's effect that would make any vaccine effectiveness estimates (naively) computed using total counts for all of 2021 inflated and misleading, much higher than the VE for each time interval if computed separately.
5/n
From the USA % vaccinated each month, and total confirmed cases by month, here is a table summarizing data assuming a population of 330 million.

Note that the monthly case count decreased 15x from Jan-June, while vaccination increased
6/n
Of course vaccines likely played a part in declining case counts over time, but the massive surge was bound to decline in the spring anyway, so this coincidence of declining cases and increasing vaccination could lead to strong confounding of time with the vaccine effect.
7/n
To illustrate this distortion, we construct a hypothetical example assuming true VE of 90% for each month, using real USA vaccination & total monthly case numbers for relevant context.

VE is computed as 1-vaccinated monthly cases per 100k/unvaccinated monthly cases per 100k
8/n
But if we computed VE cumulatively, using all data from the beginning of 2021, we get wildly inflated numbers for VE. Here we compute VE at the end of each month using all cumulative data from the start of 2021.
9/n
This is predominantly driven by a Simpson’s effect, in which the confounder (time) was strongly positively associated with exposure (vaccination) but strongly negatively associated with outcome (infections), making VE estimates computed in aggregate over time distorted.
10/n
We see the same effect for deaths. Note the monthly counts of deaths also sharply declined coming down from the winter surge in January to the pre-Delta lull in June.
11/n
Here is hypothetical data assuming for each month VE=90% vs. COVID-19 deaths.
12/n
Once again, note that if we compute VE cumulatively over time, the VE is inflated because of the time coufounding with vaccination rate and death rate in opposite directions via Simpson’s paradox.
13/n
The lesson here is to ask about the time frame in which VE is computed.

If computed over a long time period in which vaccination & infection/death levels greatly, then it is crucial to either stratify by time or adjust for time in the modeling to avoid this artifact.
14/n
Observational data can yield biased & misleading results if confounders (age, time, others too) are not properly accounted for.

Rigorous statistical design & modeling using matching, stratifying, covariate-adjusting is crucial to get reasonable VE estimates.
15/n
Here is a link to the full blog post with all explanations and data
16/n
covid-datascience.com/post/how-time-…
Sorry -- wrong plot included in 9/n -- that is the one for later when talking about deaths.

Here is the right one
UPDATED 9/n

• • •

Missing some Tweet in this thread? You can try to force a refresh
 

Keep Current with Prof Jeffrey S Morris

Prof Jeffrey S Morris Profile picture

Stay in touch and get notified when new unrolls are available from this author!

Read all threads

This Thread may be Removed Anytime!

PDF

Twitter may remove this content at anytime! Save it as PDF for later use!

Try unrolling a thread yourself!

how to unroll video
  1. Follow @ThreadReaderApp to mention us!

  2. From a Twitter thread mention us with a keyword "unroll"
@threadreaderapp unroll

Practice here first or read more on our help page!

More from @jsm2334

15 Sep
Data presented below show nearly 33% of unvaccinated adult Israeli residents were previously infected.

Why is this important & has this contributed to misinterpretation of Israeli data?

This thread wll explore these questions.
1/n
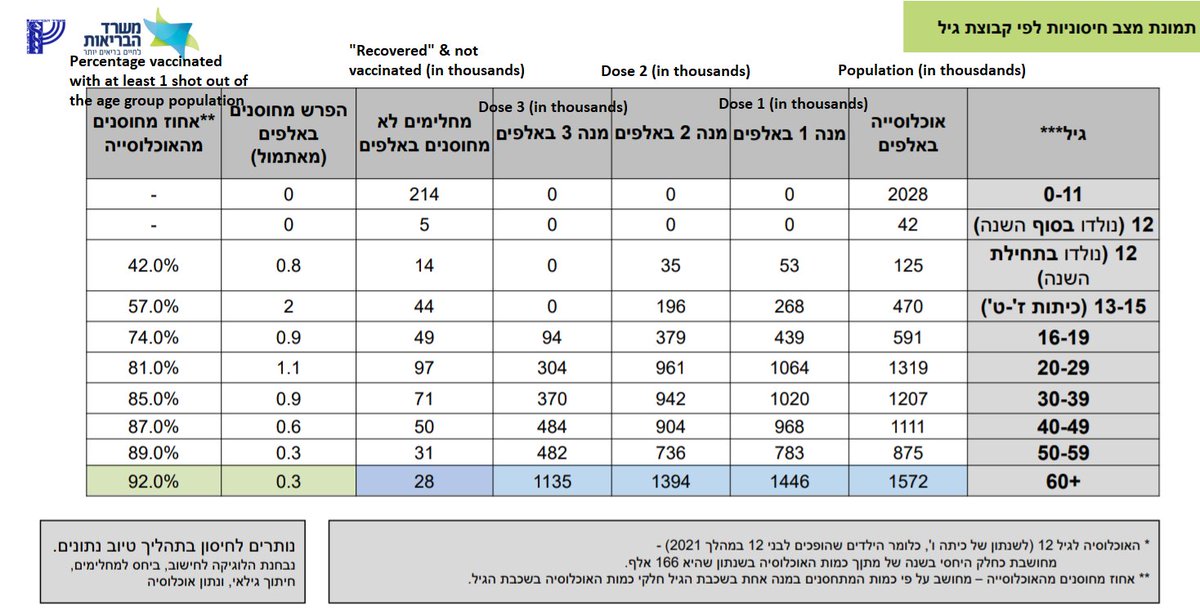
Israeli MoH releases periodic vaccination reports on its Telegram site. This table breaks down vaccination status by age groups as of September 14, 2021 listing total population and number given 1/2/3 doses plus those unvaccinated but recovered from previous infection
2/n Image
From these data, I constructed this table with % of population unvaccinated, given 1 dose, 2 doses, & 3 doses, & proportion of unvaccinated are previously infected.

Note that >30% of total unvaccinated Israelis were previously infected, & >1/3 for all age groups in 20-59yr
3/n Image
Read 13 tweets
15 Sep
I have seen a lot of people obsessing with Table 5 of the 8/21 UK Delta report:

402 Covid deaths among 47,008 fully vaccinated for case fatality rate 0.86%

253 Covid deaths among 151,054 unvaccinated for CFR=0.17%

Do vaccines increase CFR 5-fold?
1/4
assets.publishing.service.gov.uk/government/upl…
They also split data out by age (<50/>50).

For older group, CFR for vaccinated (1.81%) is 3.3-fold LOWER than CFR for unvaccinated (5.96%)

For younger group, CFR for vaccinated (0.05%) is 1.5-fold higher than CFR for unvaccinated (0.03%), but there are only 13 deaths.
2/4
Another case of Simpson's paradox, since a confounding factor (age) is STRONGLY associated with both outcome (death) and exposure (vaccination status) given risk of death in old >>> young and vaccination rate old >>> young.
3/4
Read 6 tweets
12 Sep
How well are vaccines and boosters really protecting against COVID-19 deaths?

Israel MoH publicly posted daily COVID-19 death data split by unvaccinated, boosted, and vaccinated-not-boosted from Aug10-Sept8

Here are results of my analysis of these data
1/n
Summing over all days, it is not promising to see so many COVID-19 deaths in vaccinated/boosted groups.
But by now we know better than to draw conclusions from raw counts, right?
2/n
The Israeli MoH dashboard provides enough information to infer total proportion of population unvaccinated, boosted, or vaccinated-by-not-boosted, so we can compute normalized COVID-19 death rates in these groups.

3/n
Read 13 tweets
24 Aug
New medRXiv paper by UPenn group led by John Wherry looking at immune markers 6m after vaccination.

Partially explains waning vaccine efficacy vs. infection, more durable vaccine efficacy vs. severe disease, and is relevant to current booster policy.

biorxiv.org/content/10.110…
Paper measured immune markers (antibodies, T-cells, B-cells) from 61 individuals vaccinated with Pfizer/Moderna at 6 time points, from pre-vax to 6m post-vax.

16 were previously infected with SARS-CoV-2 and 45 SARS-CoV-2 naïve, and analysis was stratified by previous infection.
The key results were:
1.Neutralizing antibodies (NAbs) decreased over time
2.Memory B cells (Bcells) increased over time and did not wane
3.Helper T cells (T4) and Killer T cells (T8) dynamic described
Read 14 tweets
24 Aug
Great tweet by Monica Gandhi on new paper on transmission using the best way to track transmission: attack rate of virus after exposure in a rigorous contact tracing setting.

A few comments about what this might mean for transmissibility of breakthrough infections...
Although not dealing with breakthrough vs. unvaccinated infections, two results that are encouraging for the notion that breakthroughs might transmit less:
1. Asymptomatic infected were >4x less likely to transmit to others than symptomatic.

We know breakthrough cases are more likely to be asymptomatic, so this suggests one reason why breakthroughs might transmit less ...
Read 7 tweets
18 Aug
@CT_Bergstrom I agree Carl.
I will write a blog post on this but one possibility is that this is a combination of
1. unmeasured confounders (eg that young people vaccinated in January are Health care workers who are tested and exposed much more than those later vaccinated young people)
@CT_Bergstrom 2. Delta effect. Since we know delta spreads faster & with 50-100x viral load, it makes sense this higher viral exposure could lead to detectable virus that would produce “asymptomatic breakthrough infections” if testing done at right time, even if the vaccine works as intended
@CT_Bergstrom 3. And based on data I’ve seen showing memory B cells and helper T cells remain maxed out at 6m (and can produce new nAbs in 2-3 days)and nAbs and killer T cells decrease 10x but still remain 10-100x prevaccine baseline, it is possible that in early months the circulating nAbs..
Read 5 tweets

Did Thread Reader help you today?

Support us! We are indie developers!


This site is made by just two indie developers on a laptop doing marketing, support and development! Read more about the story.

Become a Premium Member ($3/month or $30/year) and get exclusive features!

Become Premium

Too expensive? Make a small donation by buying us coffee ($5) or help with server cost ($10)

Donate via Paypal Become our Patreon

Thank you for your support!

Follow Us on Twitter!

:(