So @waukema stumbled onto this. Seems there’s a H1N1 wave kicking off in Europe right now. That would indicate that Covid is a spent force as it’s stopped suppressing flu wdyt @FatEmperor @MLevitt_NP2013 source apps.who.int
And @waukema found more at flunewseurope.org now 60 samples is not a wave *yet* but we’ve seen nothing all year… is that because all test capacity was diverted to Covid or was it because one ILI suppresses the others until@it is a spent force… I guess we’ll find out soon
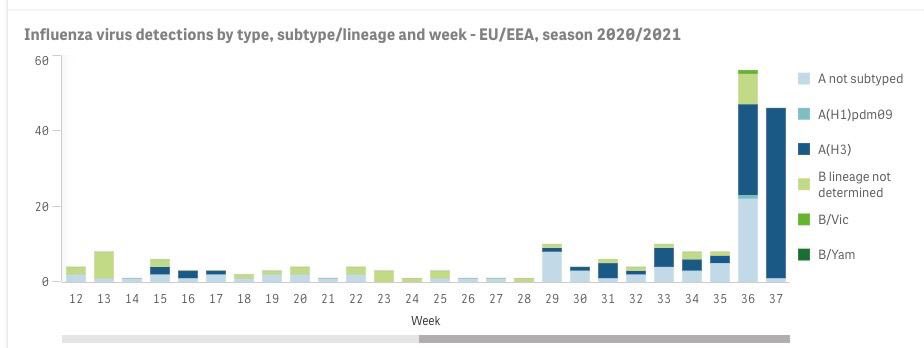
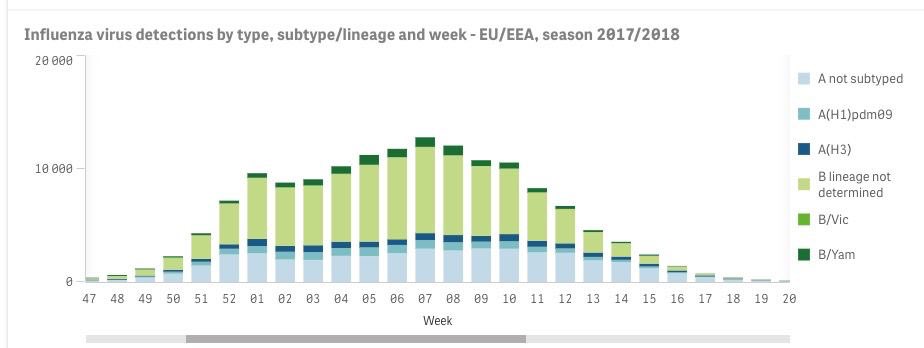
Here’s a normal year graph for comparison. Note this graph starts at week 47 whereas we are just at week 37 so while 60 is small compared to the 13,000 at week 7, waves grow from small starts
Here’s the NL reporting of ILI sentinel data. This shows the numbers reporting to their family doctors with flu like symptoms. Week 37 is normally just when the season starts to kick off. If influenza is back we should see steady growth to a maximum in Jan/Feb
The BBC are reporting an ILI that is not Covid as going around... which would also seem to support the hypothesis that the Covid pandemic is over and it's endemic now
bbc.com/news/newsbeat-…
Note: none of this is proof of anything. We are looking at the a pair of data points from week 36 and week 37. Typically these weeks are the tip of the iceberg and things grow from there... except last year that didn't happen... only last year... previous 18 years it did
So the question is this: will this year be like last yer or like every year we have data for before last year? If it's like every year before 2020 then the pandemic could well be over (unless we now have a different flu pandemic because more are susceptible)
If it's like last year then these two weeks data are a random anomaly... of course it could be entirely different from everything before and do its own thing... the next few weeks will give us an indication one way or another
Sorry read the colours wrong H3 not H1N1 which is a lighter shade of blue

• • •

Missing some Tweet in this thread? You can try to force a refresh
 

Keep Current with 😀 Stephen Connolly

😀 Stephen Connolly Profile picture

Stay in touch and get notified when new unrolls are available from this author!

Read all threads

This Thread may be Removed Anytime!

PDF

Twitter may remove this content at anytime! Save it as PDF for later use!

Try unrolling a thread yourself!

how to unroll video
  1. Follow @ThreadReaderApp to mention us!

  2. From a Twitter thread mention us with a keyword "unroll"
@threadreaderapp unroll

Practice here first or read more on our help page!

More from @connolly_s

21 Sep
Let's look at some data. 50% of the Irish population are day 60+. 10% day 120+. 4.3% day 180+. We currently have 13.5% of the population unvaccinated (including all 0-11yo). Consider medrxiv.org/content/10.110… even with is bias issues
The 4.3% vaccinated for more than 180 days -best case- have the same viral load as the 13.5% unvaccinated. That leaves 5.7% on days 120-180 with a Ct increase of 0.3 which corresponds to a viral load reduction of 19%. Then 40% on days 60-120 Ct increase of 0.7 or 39% lower load
Take a group of 20 people chosen at random (including 0-11yo). About 3 will be unvaxed. 1 will be 180+ days (same risk as unvax), 1 will be 120-180 days (81% risk), 8 will be 60-120 days (61% risk) so the 60+ days fully vax represent (1+0.81+8*0.61)/3=2.2x risk of unvaxed
Read 17 tweets
13 Sep
Some interesting questions about the new "active" and "serious" by age graph on the IMoH dashboard. Here's "active" cases and the verticle black line is when they changed the dataset they were reporting
Question 1: What has caused the surge in the population of unvaccinated people that the normalized figures have dropped. If it was that the partially vaccinated were now being counted then we would expect absolute cases for 12-15 to jump by 1400 but they fall slightly... not that
Question 2: Where did the 1400 active cases in 12-15yo disappear to? They're not added to the unvaccinated cases... they're not added to the vaccinated cases... they're not added to the 3rd shot vaccinated cases... these cases have magically disappeared
Read 12 tweets
10 Sep
Ok. So I finally automated my Z-score analysis of Israeli case data. I have yet to automate publishing the generated graphs to Twitter... but here comes 9 weeks of the same analysis methodology... so you can easily compare. First up 29th August to 4th September inclusive
2021-08-22 to 2021-08-28
2021-08-15 to 2021-08-21
Read 17 tweets
30 Aug
Latest Israeli cases analysis, and previous analysis revisited.

First a data health warning. I am basing the numbers in each dose using the published data on ages of vaccinated (data.gov.il/dataset/covid-…).

The readme (data.gov.il/dataset/covid-…) has this caveat. 🤷

(1/n)
With the new data on the 3rd dose I have had to rework the analysis, so the layout will be slightly different than previously. Also to try and limit information overload I only present Z-scores and P-values for selected comparisons against both unvax and 2 dose fully vax

(2/n)
Anyway, here's the data. Interpretation to follow...

(3/n)
Read 11 tweets
18 Aug
Here's the update for Aug 8-14th
@RanIsraeli @MLevitt_NP2013 @prof_shahar @OS51388957 @daridor
I do not think my conclusion that its different reporting rates vs vaccination status is contradicted.
At this point I think this dataset on its own is telling all it can tell 1/n
That doesn't mean there are not useful analysis that can be constructed by pairing other data sets with this data set, but certainly anyone saying this data on its own shows any conclusion about rates across vaccination status is IMHO stretching beyond breakpoint 2/n
Also you can use this data to make statements about individual groups, e.g.:
* The case rate in the vaccinated group is not non-trivial, this supports the assertion that "vaccine does not prevent infection"
3/n
Read 7 tweets
11 Aug
Latest Israeli case data... @RanIsraeli @MLevitt_NP2013 it's complicated, but I'm going to try and explain what it says and what we can conclude. First the background 1/n
So there have been these spreadsheets popping up on social media reporting the age breakdown of cases and the percentage of the population fully vaccinated and highlighting the similarity of those numbers, citing datadashboard.health.gov.il/COVID-19/gener… as the source 2/n
Using that data I was able to compute statistical Z-scores, but as I do not speak Hebrew, my ability to verify the numbers was limited. Those Z-scores implied a significant difference in the case rate between vaccinated and unvaccinated with unvaccinated lower! 3/n
Read 26 tweets

Did Thread Reader help you today?

Support us! We are indie developers!


This site is made by just two indie developers on a laptop doing marketing, support and development! Read more about the story.

Become a Premium Member ($3/month or $30/year) and get exclusive features!

Become Premium

Too expensive? Make a small donation by buying us coffee ($5) or help with server cost ($10)

Donate via Paypal Become our Patreon

Thank you for your support!

Follow Us on Twitter!

:(