𝗧𝗥𝗔𝗗𝗜𝗡𝗚 𝗖𝗔𝗡𝗗𝗟𝗘𝗦𝗧𝗜𝗖𝗞 𝗣𝗔𝗧𝗧𝗘𝗥𝗡𝗦 !📊
~𝙰 𝚃𝚑𝚛𝚎𝚊𝚍~🧵
𝙿𝚕𝚎𝚊𝚜𝚎 𝚁𝚎-𝚃𝚠𝚎𝚎𝚝 𝚝𝚑𝚒𝚜 𝚝𝚠𝚎𝚎𝚝 𝚏𝚘𝚛 𝚖𝚘𝚛𝚎 𝚛𝚎𝚊𝚌𝚑 🤞
@ProdigalTrader @SouravSenguptaI @PAlearner @Puretechnicals9 @caniravkaria @MrigankPuri @nison_steve @chartmojo
~𝙰 𝚃𝚑𝚛𝚎𝚊𝚍~🧵
𝙿𝚕𝚎𝚊𝚜𝚎 𝚁𝚎-𝚃𝚠𝚎𝚎𝚝 𝚝𝚑𝚒𝚜 𝚝𝚠𝚎𝚎𝚝 𝚏𝚘𝚛 𝚖𝚘𝚛𝚎 𝚛𝚎𝚊𝚌𝚑 🤞
@ProdigalTrader @SouravSenguptaI @PAlearner @Puretechnicals9 @caniravkaria @MrigankPuri @nison_steve @chartmojo
(1/18) In this thread, l'll try and talk about candlestick patterns, what they are, how they work, and why you don’t need to memorize any particular pattern to gauge the supply and demand of market.
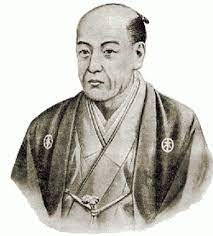
(2/18) It’s said that Japanese candlestick patterns originated from a Japanese rice trader called 𝘔𝘶𝘯𝘦𝘩𝘪𝘴𝘢 𝘏𝘰𝘯𝘮𝘢 during the 1700s. Later, this concept was introduced to the Western world by Steve Nison, in his book, 'Japanese Candlestick Charting Techniques'. 

(3/18) Every candlestick pattern has four data points:
𝗢𝗽𝗲𝗻: The opening price.
𝗛𝗶𝗴𝗵: The highest price over a specific time period.
𝗟𝗼𝘄: The lowest price over a specific time period.
𝗖𝗹𝗼𝘀𝗲: The closing price.
Here’s an example:
𝗢𝗽𝗲𝗻: The opening price.
𝗛𝗶𝗴𝗵: The highest price over a specific time period.
𝗟𝗼𝘄: The lowest price over a specific time period.
𝗖𝗹𝗼𝘀𝗲: The closing price.
Here’s an example:
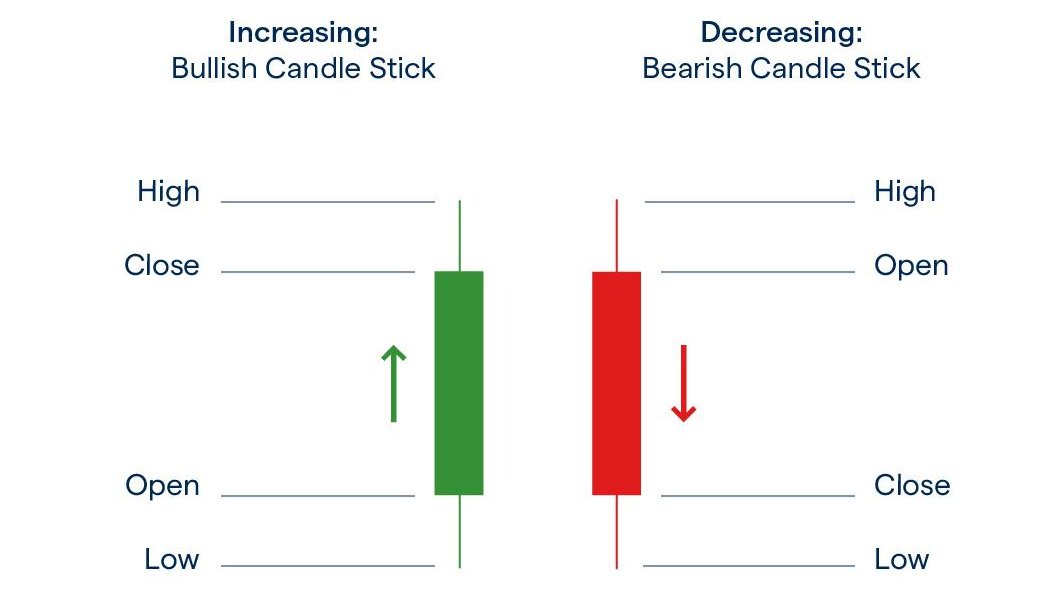
(4/18) Now a thing to note is that candlestick patterns maybe both bullish or bearish and there are single candlestick patterns, two candlestick patterns and even three candlestick patterns.
𝐂𝐀𝐍𝐃𝐋𝐄𝐒𝐓𝐈𝐂𝐊 𝐂𝐇𝐄𝐀𝐓𝐒𝐇𝐄𝐄𝐓:
𝐂𝐀𝐍𝐃𝐋𝐄𝐒𝐓𝐈𝐂𝐊 𝐂𝐇𝐄𝐀𝐓𝐒𝐇𝐄𝐄𝐓:
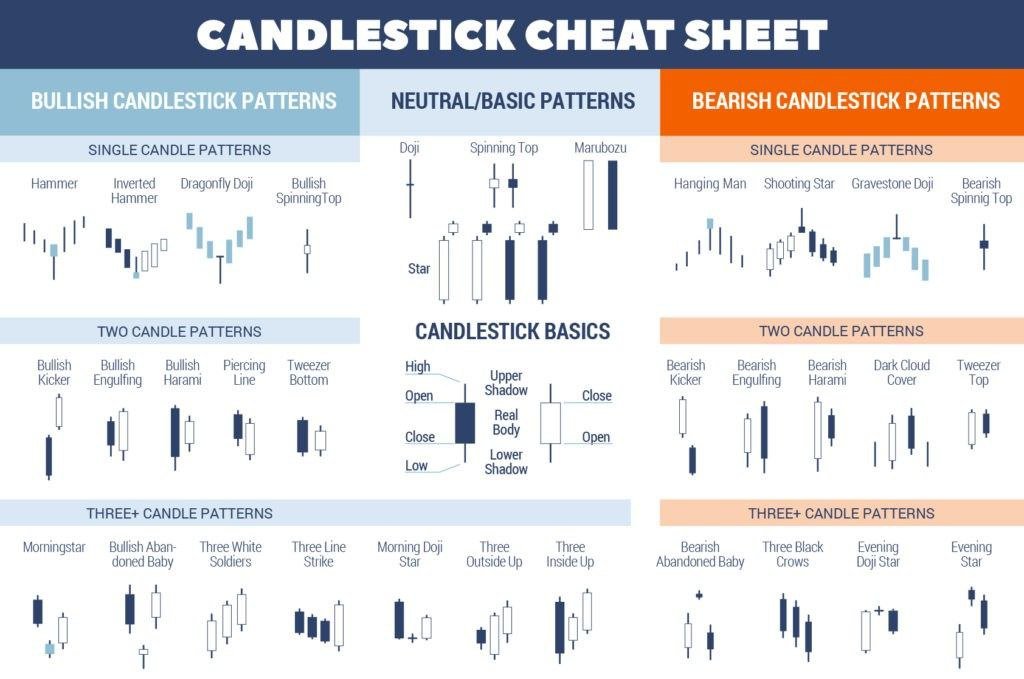
(5/18) But, in this thread I'll not go deep into multiple candlestick patterns, rather I'll try and explain the underlying dynamics of single candlesticks and how they can used efficiently to make better trading decisions.
(6/18) 𝗧𝗵𝗲 𝗠𝗮𝗿𝘂𝗯𝗼𝘇𝘂
A Marubuzo indicates that there is so much buying/selling interest in a stock that the market participants were willing to buy/sell the stock at every price point during the day, so much so that the stock closed near its high/low point for the day.
A Marubuzo indicates that there is so much buying/selling interest in a stock that the market participants were willing to buy/sell the stock at every price point during the day, so much so that the stock closed near its high/low point for the day.
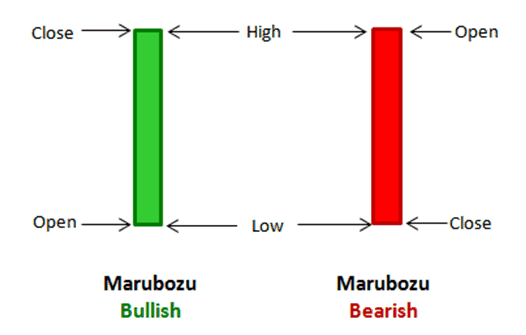
(7/18) It does not matter what the prior trend has been, the action on the marubuzo day suggests that the sentiment has changed and the stock in now bullish/bearish.
(8/18) 𝗧𝗵𝗲 𝗗𝗼𝗷𝗶
This means the open and close prices are equal. Doji’s provide crucial information about the market sentiments and is an important candlestick pattern.
This means the open and close prices are equal. Doji’s provide crucial information about the market sentiments and is an important candlestick pattern.
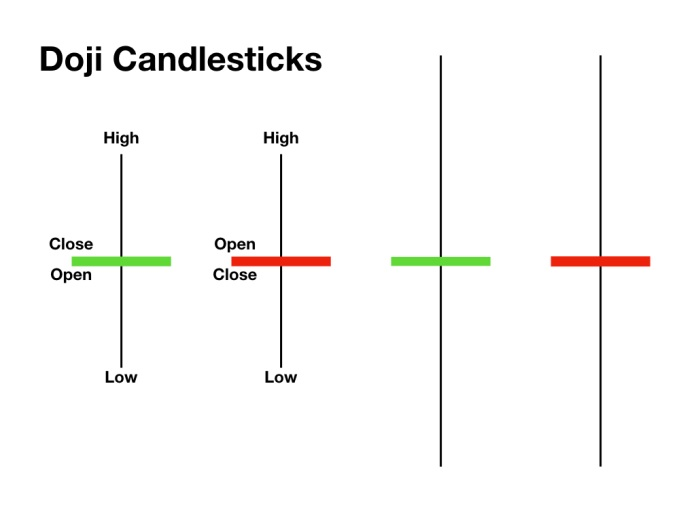
(9/18) The doji candle signals that there is indecision is the market. The market could swing either ways and you need to build a stance that adapts to the expected movement in the market. Even if there is a thin body, the candle can be considered as a doji.
(10/18) 𝗧𝗵𝗲 𝐇𝐚𝐦𝐦𝐞𝐫
The bullish hammer is a significant candlestick pattern that occurs at the bottom of the trend. A hammer consists of small real body at the upper end of the trading range with a long lower shadow. The longer the lower shadow the more bullish it is.
The bullish hammer is a significant candlestick pattern that occurs at the bottom of the trend. A hammer consists of small real body at the upper end of the trading range with a long lower shadow. The longer the lower shadow the more bullish it is.
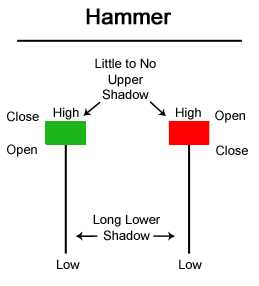
(11/18) A hammer can be of any color as it does not really matter as long as it qualifies ‘the shadow to real body’ ratio. However, it is slightly more comforting to see a bullish body. Since, the hammer is seen after a downtrend, it shows demand.
(12/18) 𝗧𝗵𝗲 𝗦𝗵𝗼𝗼𝘁𝗶𝗻𝗴 𝘀𝘁𝗮𝗿 [𝘐𝘯𝘷𝘦𝘳𝘵𝘦𝘥 𝘏𝘢𝘮𝘮𝘦𝘳]
The shooting star is a top reversal pattern. A shooting star signals a market high. Since the shooting star is seen after a high, the pattern signals selling pressure.
The shooting star is a top reversal pattern. A shooting star signals a market high. Since the shooting star is seen after a high, the pattern signals selling pressure.
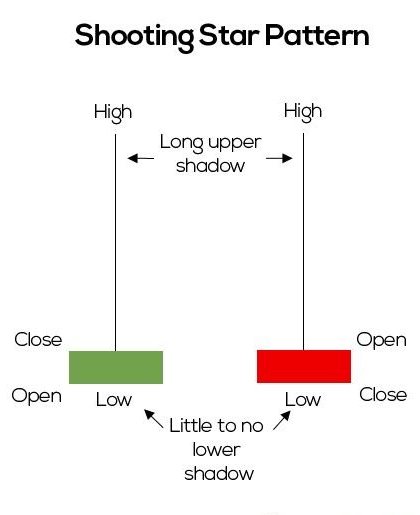
(13/18) The colour of the body does not matter, but the pattern is slightly more reliable if the real body is red. The longer the upper wick, the more bearish is the pattern.
(14/18) Now there are two questions you must ask yourself when you analyze candlestick patterns-
𝗤𝘂𝗲𝘀𝘁𝗶𝗼𝗻 𝟭: 𝗪𝗵𝗲𝗿𝗲 𝗱𝗶𝗱 𝘁𝗵𝗲 𝗽𝗿𝗶𝗰𝗲 𝗰𝗹𝗼𝘀𝗲 𝗿𝗲𝗹𝗮𝘁𝗶𝘃𝗲 𝘁𝗼 𝘁𝗵𝗲 𝗿𝗮𝗻𝗴𝗲?
𝗤𝘂𝗲𝘀𝘁𝗶𝗼𝗻 𝟭: 𝗪𝗵𝗲𝗿𝗲 𝗱𝗶𝗱 𝘁𝗵𝗲 𝗽𝗿𝗶𝗰𝗲 𝗰𝗹𝗼𝘀𝗲 𝗿𝗲𝗹𝗮𝘁𝗶𝘃𝗲 𝘁𝗼 𝘁𝗵𝗲 𝗿𝗮𝗻𝗴𝗲?
(15/18) We need to ask who’s in control?
Well, if the price closed the near highs of the range, that tells you the buyers are in control. But, if the price closed near the lows of the range and shows rejection of higher prices, it shows that sellers are in control.
Well, if the price closed the near highs of the range, that tells you the buyers are in control. But, if the price closed near the lows of the range and shows rejection of higher prices, it shows that sellers are in control.
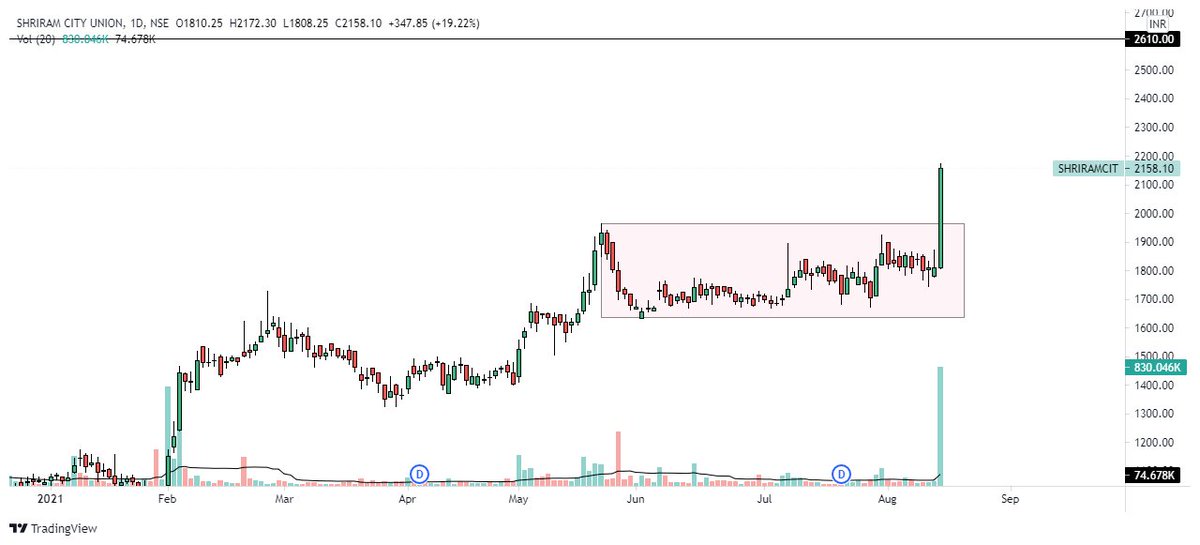
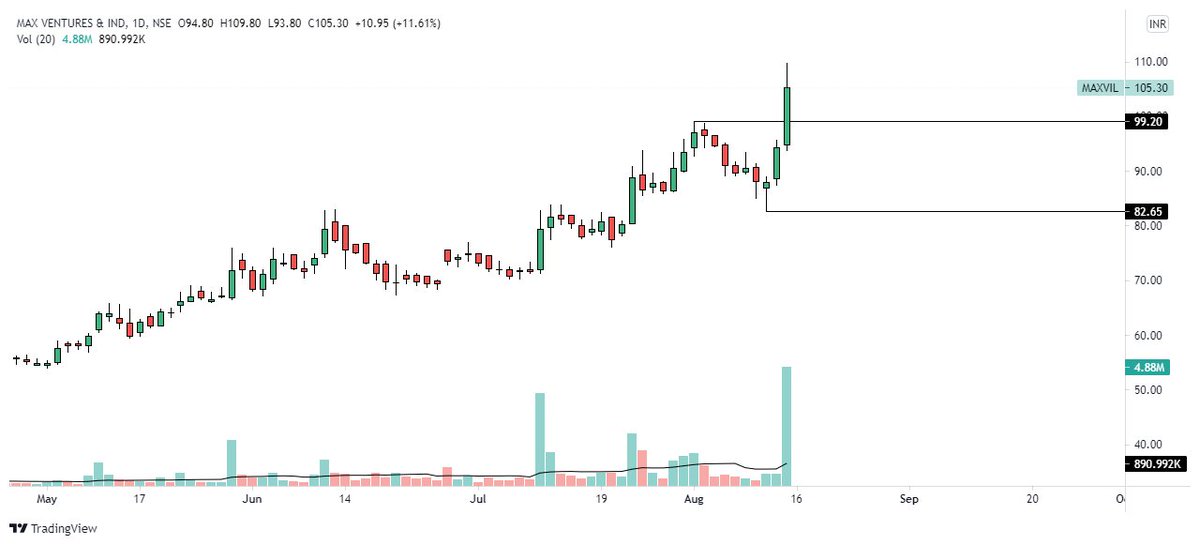
(16/18) 𝐐𝐮𝐞𝐬𝐭𝐢𝐨𝐧 𝟐: 𝐖𝐡𝐚𝐭’𝐬 𝐭𝐡𝐞 𝐬𝐢𝐳𝐞 𝐨𝐟 𝐭𝐡𝐞 𝐜𝐚𝐧𝐝𝐥𝐞𝐬𝐭𝐢𝐜𝐤 𝐩𝐚𝐭𝐭𝐞𝐫𝐧 𝐫𝐞𝐥𝐚𝐭𝐢𝐯𝐞 𝐭𝐨 𝐭𝐡𝐞 𝐞𝐚𝐫𝐥𝐢𝐞𝐫 𝐨𝐧𝐞𝐬?
This question will help you determine if there’s any
strength (or conviction) behind the move.
This question will help you determine if there’s any
strength (or conviction) behind the move.
(17/18) If the current candle is much larger (like two or more times larger), this tells you there’s strength behind the move.
(18/18)𝙏𝙝𝙖𝙣𝙠 𝙮𝙤𝙪!
And, please point out if there is any mistake on my end. Would love to hear each and everyone's views.
If you liked reading this then please Re-Tweet the first tweet in this thread and follow @sarosij_ghosh for more stuff on trading & investing. 😇🙏
And, please point out if there is any mistake on my end. Would love to hear each and everyone's views.
If you liked reading this then please Re-Tweet the first tweet in this thread and follow @sarosij_ghosh for more stuff on trading & investing. 😇🙏
• • •
Missing some Tweet in this thread? You can try to
force a refresh