1/
Get a cup of coffee.
This is a thread that @ruima and I wrote jointly.
In this thread, we'll help you estimate how much "margin of safety" a company has when it's loaded with debt.
Understanding this will help you avoid Evergrande-type fiascos in your own portfolio.
Get a cup of coffee.
This is a thread that @ruima and I wrote jointly.
In this thread, we'll help you estimate how much "margin of safety" a company has when it's loaded with debt.
Understanding this will help you avoid Evergrande-type fiascos in your own portfolio.

2/
For both individuals and companies, "taking on debt" means "agreeing to a set of future financial obligations".
For example, when we take out a 30-year $400K mortgage at 3% interest, we're agreeing to pay the bank about $1686 per month, every month, for the next 30 years.
For both individuals and companies, "taking on debt" means "agreeing to a set of future financial obligations".
For example, when we take out a 30-year $400K mortgage at 3% interest, we're agreeing to pay the bank about $1686 per month, every month, for the next 30 years.

3/
Similarly, when a company like Home Depot issues a bond, they're agreeing to pay interest and principal according to a set schedule.
Like so:
Similarly, when a company like Home Depot issues a bond, they're agreeing to pay interest and principal according to a set schedule.
Like so:

4/
Usually, to *fulfill* these kinds of obligations, we need *cash generating power*.
For example, if we make only $1000 per month, it's probably not a good idea to take on a mortgage that requires us to pay ~$1686 monthly.
Our *obligation* would exceed our *cash flows*.
Usually, to *fulfill* these kinds of obligations, we need *cash generating power*.
For example, if we make only $1000 per month, it's probably not a good idea to take on a mortgage that requires us to pay ~$1686 monthly.
Our *obligation* would exceed our *cash flows*.
5/
In addition to the *size* of our cash flows, their *timing* also matters.
We may be able to *generate* lots of cash.
But if the cash doesn't come to us *in time* to meet our obligations, we may be forced to default on them.
In addition to the *size* of our cash flows, their *timing* also matters.
We may be able to *generate* lots of cash.
But if the cash doesn't come to us *in time* to meet our obligations, we may be forced to default on them.
6/
For example, suppose Home Depot wants to borrow $5M and use it to open a new store.
The store may generate gobs of cash.
But it may take a year to build.
During this year, there may be interest and/or principal payments due on the $5M loan.
For example, suppose Home Depot wants to borrow $5M and use it to open a new store.
The store may generate gobs of cash.
But it may take a year to build.
During this year, there may be interest and/or principal payments due on the $5M loan.
7/
If that's the case, Home Depot should have a plan for covering these payments from some other source.
For example, cash on hand.
Or cash produced by some other store that's already operational.
If that's the case, Home Depot should have a plan for covering these payments from some other source.
For example, cash on hand.
Or cash produced by some other store that's already operational.
8/
That's pretty much what intelligent debt management is all about.
We make a list of all our obligations.
From this, we work backwards.
We make sure that the *size* and *timing* of our cash flows will let us comfortably meet our obligations -- with very high probability.
That's pretty much what intelligent debt management is all about.
We make a list of all our obligations.
From this, we work backwards.
We make sure that the *size* and *timing* of our cash flows will let us comfortably meet our obligations -- with very high probability.
9/
To concretize this, let's look at an example.
Imagine we want to buy a house.
The house costs $500K.
The bank is willing to give us a 30-year $400K mortgage at 3% interest.
But we have to come up with the other $100K on our own. That's our down payment.
To concretize this, let's look at an example.
Imagine we want to buy a house.
The house costs $500K.
The bank is willing to give us a 30-year $400K mortgage at 3% interest.
But we have to come up with the other $100K on our own. That's our down payment.
10/
Suppose we have only $70K in the bank.
Not enough for our $100K down payment.
Also, we don't want to scrape the bottom of our bank account. We want to have at least $20K in the bank at all times. That's our "rainy day" fund.
Suppose we have only $70K in the bank.
Not enough for our $100K down payment.
Also, we don't want to scrape the bottom of our bank account. We want to have at least $20K in the bank at all times. That's our "rainy day" fund.
11/
So, like any good child, we borrow $50K from our parents. Interest free, of course.
That gets our bank account to $70K + $50K = $120K.
We can now make the $100K down payment.
And we'll still have $20K left over for our rainy day fund -- as we wanted.
So, like any good child, we borrow $50K from our parents. Interest free, of course.
That gets our bank account to $70K + $50K = $120K.
We can now make the $100K down payment.
And we'll still have $20K left over for our rainy day fund -- as we wanted.
12/
On October 1'st 2021, we close on our house.
Now, we have a few *obligations*, thanks to all the debt we've incurred.
First, there's our obligation to the bank. That's ~$1686 per month, due at the end of each month, for the next 30 years.
On October 1'st 2021, we close on our house.
Now, we have a few *obligations*, thanks to all the debt we've incurred.
First, there's our obligation to the bank. That's ~$1686 per month, due at the end of each month, for the next 30 years.
13/
Including property taxes, homeowner's insurance, etc., let's call it an even $2500 per month.
Second, we have an obligation to return the $50K we borrowed from our parents. Let's say we want to do this by writing a single check, at the end of Jun 2022.
Including property taxes, homeowner's insurance, etc., let's call it an even $2500 per month.
Second, we have an obligation to return the $50K we borrowed from our parents. Let's say we want to do this by writing a single check, at the end of Jun 2022.
14/
So, our obligations are roughly: $2.5K per month for the next 30 years, plus an additional $50K during one specific month (Jun 2022).
Like so:
So, our obligations are roughly: $2.5K per month for the next 30 years, plus an additional $50K during one specific month (Jun 2022).
Like so:

15/
The question is: what should our *cash generating power* look like, if we are to meet these obligations?
To ask the question slightly differently: what is the *minimum* amount of money we need to make per month, so that we can meet all our obligations?
The question is: what should our *cash generating power* look like, if we are to meet these obligations?
To ask the question slightly differently: what is the *minimum* amount of money we need to make per month, so that we can meet all our obligations?
16/
Well, over the first 9 months (Oct 2021 through Jun 2022), we have 9 $2.5K mortgage payments and a $50K lump sum coming due.
That's 9*$2.5K + $50K = $72.5K.
So, over the first 9 months, we need to make at least $72.5K/9 = ~$8.1K per month to meet our obligations.
Well, over the first 9 months (Oct 2021 through Jun 2022), we have 9 $2.5K mortgage payments and a $50K lump sum coming due.
That's 9*$2.5K + $50K = $72.5K.
So, over the first 9 months, we need to make at least $72.5K/9 = ~$8.1K per month to meet our obligations.
17/
At the end of Jun 2022, the $50K will be paid off.
So, starting Jul 2022, we no longer need ~$8.1K per month. Just $2.5K per month will let us meet our obligations.
So, at a *minimum*, our cash generating power should look like the green line below:
At the end of Jun 2022, the $50K will be paid off.
So, starting Jul 2022, we no longer need ~$8.1K per month. Just $2.5K per month will let us meet our obligations.
So, at a *minimum*, our cash generating power should look like the green line below:

18/
Of course, we can make more in some months and less in other months -- and still meet our obligations.
There are many possible solutions.
For example, one (rather extreme) solution is to make $52.5K in Jun 2022 alone, and $2.5K every other month.
Of course, we can make more in some months and less in other months -- and still meet our obligations.
There are many possible solutions.
For example, one (rather extreme) solution is to make $52.5K in Jun 2022 alone, and $2.5K every other month.
19/
But that's like saying: I want to run a marathon in 2.5 hours. So, I'll cover 385 yards in the first 2 hours and 26 miles in the next half hour.
Just because we have an obligation to meet, the cash won't suddenly appear.
We have to *pace* our cash generation intelligently.
But that's like saying: I want to run a marathon in 2.5 hours. So, I'll cover 385 yards in the first 2 hours and 26 miles in the next half hour.
Just because we have an obligation to meet, the cash won't suddenly appear.
We have to *pace* our cash generation intelligently.
20/
Our "green line" does exactly that.
It paces our cash generation beautifully, by *minimizing* the *maximum* pace required.
In optimization theory, this is called a "minimax" solution.
*Every* other solution is guaranteed to equal or exceed ~$8.1K per month at some point.
Our "green line" does exactly that.
It paces our cash generation beautifully, by *minimizing* the *maximum* pace required.
In optimization theory, this is called a "minimax" solution.
*Every* other solution is guaranteed to equal or exceed ~$8.1K per month at some point.

21/
Our "margin of safety" is thus how much money we make *over and above* the minimum needed to meet our obligations.
For example, if our job pays us $20K per month, we'd have a high margin of safety -- because our income ($20K) would be ~2.47x the minimum we need (~$8.1K).
Our "margin of safety" is thus how much money we make *over and above* the minimum needed to meet our obligations.
For example, if our job pays us $20K per month, we'd have a high margin of safety -- because our income ($20K) would be ~2.47x the minimum we need (~$8.1K).
22/
The concepts above (ie, the *size* and *timing* of cash flows relative to obligations, the minimax solution, margin of safety, etc.) apply not just to individuals, but also to companies.
After all, companies should also generate enough cash to meet their obligations!
The concepts above (ie, the *size* and *timing* of cash flows relative to obligations, the minimax solution, margin of safety, etc.) apply not just to individuals, but also to companies.
After all, companies should also generate enough cash to meet their obligations!
23/
For example, let's apply these concepts to assess Home Depot (HD)'s margin of safety.
HD's 2020 10-K contains a list of all the debt they owed as of Jan 31, 2021.
Their total debt was a hefty ~$34.75B, with maturities running all the way to 2056:
For example, let's apply these concepts to assess Home Depot (HD)'s margin of safety.
HD's 2020 10-K contains a list of all the debt they owed as of Jan 31, 2021.
Their total debt was a hefty ~$34.75B, with maturities running all the way to 2056:

24/
And since the 2020 10-K came out, HD has issued another $3B of debt:
And since the 2020 10-K came out, HD has issued another $3B of debt:

25/
The orange bars below show HD's obligations to pay back all this debt over time.
(Note: in addition to these "principal" repayments, HD also has interest obligations. In 2020, interest expense was about $1.3B.)
The orange bars below show HD's obligations to pay back all this debt over time.
(Note: in addition to these "principal" repayments, HD also has interest obligations. In 2020, interest expense was about $1.3B.)

26/
Offsetting this debt, HD had $4.6B of cash on their balance sheet as of Aug 1, 2021.
Let's give them a $2.5B "rainy day" fund -- ie, we'll never let their cash balance go below $2.5B.
With this constraint, here's our minimax solution for HD:
Offsetting this debt, HD had $4.6B of cash on their balance sheet as of Aug 1, 2021.
Let's give them a $2.5B "rainy day" fund -- ie, we'll never let their cash balance go below $2.5B.
With this constraint, here's our minimax solution for HD:

27/
The minimax solution tells us that HD needs to generate no more than ~$1.5B of cash per year to meet its principal obligations.
Throw in another ~$1.3B for interest, and we get to ~$2.8B per year.
The minimax solution tells us that HD needs to generate no more than ~$1.5B of cash per year to meet its principal obligations.
Throw in another ~$1.3B for interest, and we get to ~$2.8B per year.
28/
And how much cash does HD actually generate?
Well, *after* interest expenses, here's how much HD reported in Free Cash Flow (operating cash flow minus capex) during the last 3 years:
2020: ~$16.4B,
2019: ~$11B, and
2018: ~$10.7B.
And how much cash does HD actually generate?
Well, *after* interest expenses, here's how much HD reported in Free Cash Flow (operating cash flow minus capex) during the last 3 years:
2020: ~$16.4B,
2019: ~$11B, and
2018: ~$10.7B.
29/
So, HD needs a *minimum* of ~$1.5B per year.
But *actually*, in the last 3 years, they generated about 7x to 11x times that.
That's a pretty big margin of safety!
Their cash flows can drop 85% -- and they'll still be able to make good on their obligations.
So, HD needs a *minimum* of ~$1.5B per year.
But *actually*, in the last 3 years, they generated about 7x to 11x times that.
That's a pretty big margin of safety!
Their cash flows can drop 85% -- and they'll still be able to make good on their obligations.
30/
Key lesson:
We shouldn't just look at *how much* debt a company has.
We should also take into account how the debt is structured, the cash flows required to fulfill it, and the margin of safety that's present given the business's recent and likely future cash flows.
Key lesson:
We shouldn't just look at *how much* debt a company has.
We should also take into account how the debt is structured, the cash flows required to fulfill it, and the margin of safety that's present given the business's recent and likely future cash flows.
31/
Let's now take a company that has perhaps NOT managed its debt very well.
You guessed it! We're talking about Evergrande -- the Chinese home builder that's in the news for all the wrong reasons.
Using the same concepts, let's assess Evergrande's margin of safety.
Let's now take a company that has perhaps NOT managed its debt very well.
You guessed it! We're talking about Evergrande -- the Chinese home builder that's in the news for all the wrong reasons.
Using the same concepts, let's assess Evergrande's margin of safety.

32/
@ruima helped me translate Evergrande's 2020 financial statements into English.
Here are some key line items from these statements:
@ruima helped me translate Evergrande's 2020 financial statements into English.
Here are some key line items from these statements:


33/
As of Dec 31 2020, Evergrande had ~335B RMB of loans maturing in the next year or so.
Offsetting this, they had ~159B RMB of cash on hand.
So, just to meet their short-term loan obligations, they needed to generate 335B - 159B = ~176B RMB of cash in the next year or so.
As of Dec 31 2020, Evergrande had ~335B RMB of loans maturing in the next year or so.
Offsetting this, they had ~159B RMB of cash on hand.
So, just to meet their short-term loan obligations, they needed to generate 335B - 159B = ~176B RMB of cash in the next year or so.
34/
And how much cash did they actually generate?
Well, in the last 2 years, they reported Operating Cash Flow (NOT Free Cash Flow) as follows:
2020: ~110B RMB, and
2019: NEGATIVE ~67B RMB.
Just based on this, we have at least a ~66B RMB shortfall.
No margin of safety here!
And how much cash did they actually generate?
Well, in the last 2 years, they reported Operating Cash Flow (NOT Free Cash Flow) as follows:
2020: ~110B RMB, and
2019: NEGATIVE ~67B RMB.
Just based on this, we have at least a ~66B RMB shortfall.
No margin of safety here!
35/
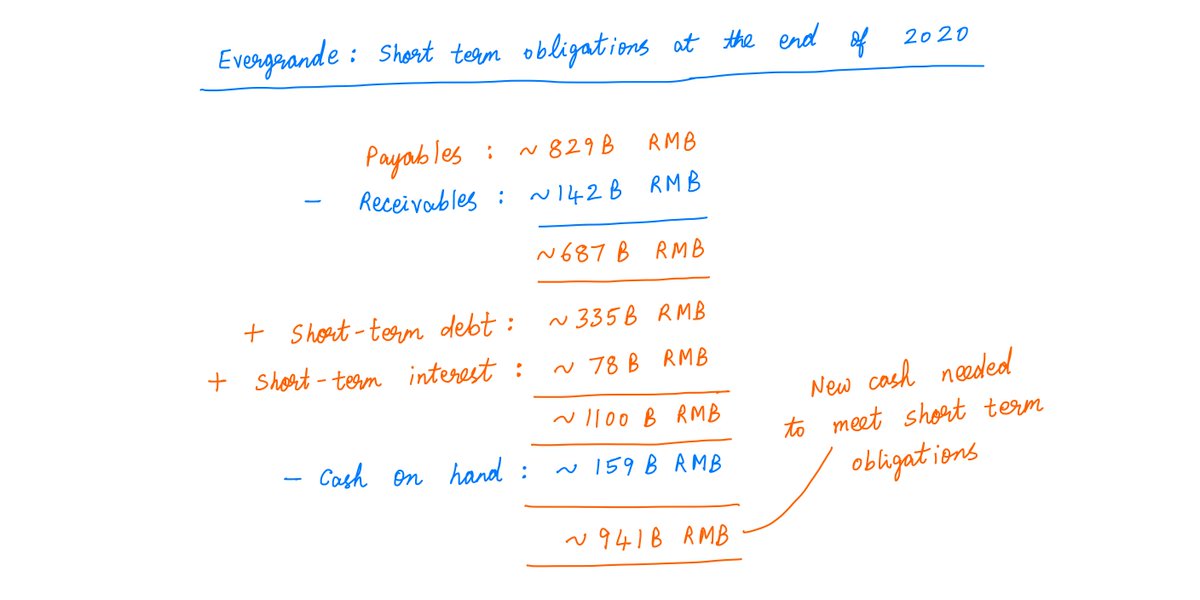
Also, in addition to *debt* obligations, Evergrande also had obligations to its *suppliers* -- payables (net of receivables) of ~687B RMB.
Just to make good on these 2 short-term obligations, they needed to raise ~941B RMB of cash in the next year or so:
Also, in addition to *debt* obligations, Evergrande also had obligations to its *suppliers* -- payables (net of receivables) of ~687B RMB.
Just to make good on these 2 short-term obligations, they needed to raise ~941B RMB of cash in the next year or so:
36/
There was only one problem with that.
Evergrande's entire 2020 revenue was only ~507B RMB.
When your annual *revenue* is ~507B RMB, it can be difficult to lay hands on ~941B RMB.
Unless you liquidate assets or issue new debt/equity.
There was only one problem with that.
Evergrande's entire 2020 revenue was only ~507B RMB.
When your annual *revenue* is ~507B RMB, it can be difficult to lay hands on ~941B RMB.
Unless you liquidate assets or issue new debt/equity.
37/
Evergrande's business model went roughly like this:
a) Issue debt,
b) Buy land with debt + cash on hand,
c) Get building materials from suppliers,
d) Tell suppliers you'll pay them later,
e) Build homes,
f) Sell homes,
g) Pay suppliers,
h) Pay interest, and
i) Repeat.
Evergrande's business model went roughly like this:
a) Issue debt,
b) Buy land with debt + cash on hand,
c) Get building materials from suppliers,
d) Tell suppliers you'll pay them later,
e) Build homes,
f) Sell homes,
g) Pay suppliers,
h) Pay interest, and
i) Repeat.
38/
*Continuously* repeating this loop is hard.
The loop is vulnerable to all sorts of things: government regulations limiting debt, construction delays, a slowdown in the real estate market, banks tightening their mortgage policies, etc.
Sooner or later, the fun had to stop.
*Continuously* repeating this loop is hard.
The loop is vulnerable to all sorts of things: government regulations limiting debt, construction delays, a slowdown in the real estate market, banks tightening their mortgage policies, etc.
Sooner or later, the fun had to stop.
39/
To learn more about Evergrande and its financial statements, I recommend this thread by @FabiusMercurius:
To learn more about Evergrande and its financial statements, I recommend this thread by @FabiusMercurius:
https://twitter.com/FabiusMercurius/status/1439218956779151361?s=20
40/
Also, without @ruima's help, this thread wouldn't have been possible.
Rui is very knowledgeable about all things China. In particular, Chinese tech companies.
If you're interested in this sort of thing, give her a follow! And get her wonderful free podcast, @TechBuzzChina.
Also, without @ruima's help, this thread wouldn't have been possible.
Rui is very knowledgeable about all things China. In particular, Chinese tech companies.
If you're interested in this sort of thing, give her a follow! And get her wonderful free podcast, @TechBuzzChina.
41/
Also, Rui runs a paid "Tech Buzz China Insider" community for people serious about investing in China.
And I mean serious. You have to pass a quiz to become a member!
If you want in, go to bit.ly/tbciapp and use coupon 10KDIVER for 10% off your first 6 months.
Also, Rui runs a paid "Tech Buzz China Insider" community for people serious about investing in China.
And I mean serious. You have to pass a quiz to become a member!
If you want in, go to bit.ly/tbciapp and use coupon 10KDIVER for 10% off your first 6 months.
42/
In this age of super low interest rates, lots of companies are taking on lots of debt.
Some are doing it intelligently.
Others are doing it indiscriminately.
I hope this thread helps you identify who is who.
Thank you very much, stay safe, and enjoy your weekend!
/End
In this age of super low interest rates, lots of companies are taking on lots of debt.
Some are doing it intelligently.
Others are doing it indiscriminately.
I hope this thread helps you identify who is who.
Thank you very much, stay safe, and enjoy your weekend!
/End
• • •
Missing some Tweet in this thread? You can try to
force a refresh