
A thread between normal divergence and hidden divergence between price and RSI (Relative Strength Index)
If you find the thread useful, please feel free to like and retweet
#trading #investing #technicals #RSI
If you find the thread useful, please feel free to like and retweet
#trading #investing #technicals #RSI
A NORMAL divergence (henceforth, I will simply call this as divergence) occurs when RSI is at an EXTREME (around 70 & above or 30 & below). It is a REVERSAL pattern, wherein you trade against the direction of the larger trend
A HIDDEN divergence occurs when RSI is typically around the CENTER (around 40 to 60). It is a CONTINUATION pattern, wherein you trade in the direction of the larger trend
The concept of Hidden divergence was introduced by Andrew Cardwell, a renowned global authority on RSI
The concept of Hidden divergence was introduced by Andrew Cardwell, a renowned global authority on RSI
Andrew Cardwell also spoke of a way in which price targets could be forecasted using hidden divergences (I will talk more on how this can be done, later in this thread)
There are 2 types of divergence: bullish & bearish
Bullish divergence puts you on BUY ALERT MODE, while bearish divergence puts you on SELL ALERT MODE
That said, remember: Actual buy/sell signals are triggered from price action only. RSI just provides a warning, not a signal
Bullish divergence puts you on BUY ALERT MODE, while bearish divergence puts you on SELL ALERT MODE
That said, remember: Actual buy/sell signals are triggered from price action only. RSI just provides a warning, not a signal
Bullish divergence occurs in a DOWNTREND & when RSI has ventured into oversold zone (usually 30 & below). In a bullish divergence, price makes a LOWER LOW & RSI makes a HIGHER LOW
What it tells is that the new low in price is coming on the back of weakening bearish momentum
What it tells is that the new low in price is coming on the back of weakening bearish momentum

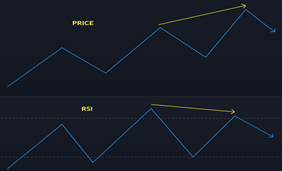
Bearish divergence occurs in an UPTREND & when RSI has ventured into overbought zone (usually 70 & above). In a bearish divergence, price makes a HIGHER HIGH & RSI makes a LOWER HIGH
What it tells is that the new high in price is coming on the back of weakening bullish momentum
What it tells is that the new high in price is coming on the back of weakening bullish momentum
There are 2 types of hidden divergence: Positive & Negative
Positive reversal (aka bullish hidden divergence) puts you on a BUY ALERT MODE, while Negative reversal (aka bearish hidden divergence) puts you on a SELL ALERT MODE
Again remember: Trade signals are generated by price
Positive reversal (aka bullish hidden divergence) puts you on a BUY ALERT MODE, while Negative reversal (aka bearish hidden divergence) puts you on a SELL ALERT MODE
Again remember: Trade signals are generated by price
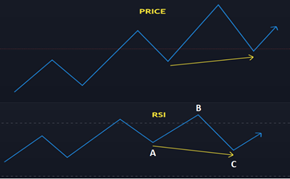
Positive reversal occurs in an UPTREND and when RSI is typically between 40 and 60 (not a hard & fast rule). In a positive reversal, price makes a HIGHER LOW and RSI makes a LOWER LOW
What it tells is that the RSI is kind of getting oversold but at a relatively higher price
What it tells is that the RSI is kind of getting oversold but at a relatively higher price

Negative reversal occurs in a DOWNTREND & when RSI is typically between 40 & 60 (not a hard & fast rule). In a negative reversal, price makes a LOWER HIGH & RSI makes a HIGHER HIGH
What it tells is that the RSI is kind of getting overbought but at a relatively lower price
What it tells is that the RSI is kind of getting overbought but at a relatively lower price

How to trade a BULLISH DIVERGENCE:
1. Enter a LONG position once you get a signal from the price action (say, resistance breakout)
2. Place a stop loss below the recent swing low (or any important support you see)
3. Let your profits run and keep trailing your stop loss higher
1. Enter a LONG position once you get a signal from the price action (say, resistance breakout)
2. Place a stop loss below the recent swing low (or any important support you see)
3. Let your profits run and keep trailing your stop loss higher
How to trade a BEARISH DIVERGENCE:
1. Enter a SHORT position once you get a signal from the price action (say, a support break)
2. Place a stop loss above the recent swing high (or any important resistance you see)
3. Let your profits run and keep trailing your stop loss lower
1. Enter a SHORT position once you get a signal from the price action (say, a support break)
2. Place a stop loss above the recent swing high (or any important resistance you see)
3. Let your profits run and keep trailing your stop loss lower
How to trade a POSITIVE REVERSAL:
1. Enter a LONG position once you get a signal from the price action
2. Place a stop loss below the recent swing low (or any important support you see)
3. Target: (Closing price at C – Closing price at A) + Closing price at B (see chart👇)
1. Enter a LONG position once you get a signal from the price action
2. Place a stop loss below the recent swing low (or any important support you see)
3. Target: (Closing price at C – Closing price at A) + Closing price at B (see chart👇)
How to trade NEGATIVE REVERSAL:
1. Enter a SHORT position once you get a signal from the price action
2. Place a stop loss above the recent swing high (or any important resistance you see)
3. Target: Closing price at B – (Closing price at A – Closing price at C) (see chart👇)
1. Enter a SHORT position once you get a signal from the price action
2. Place a stop loss above the recent swing high (or any important resistance you see)
3. Target: Closing price at B – (Closing price at A – Closing price at C) (see chart👇)

Just like everything else, keep in mind that divergences and hidden divergences are not fool proof. They do fail, just like other signals do
What is important is knowing what to do when a signal is behaving contrary to your expectations
RISK MANAGEMENT IS ABSOLUTELY CRITICAL
What is important is knowing what to do when a signal is behaving contrary to your expectations
RISK MANAGEMENT IS ABSOLUTELY CRITICAL
To learn more about these signals as well as other RSI signals, watch the recording of a two-series webinar that we @fyers1 recently conducted on RSI.
The links are shared in the following threads
The links are shared in the following threads
RSI Webinar 1: Basics and Basic Strategies
- What is RSI?
- How is RSI calculated
- How to calculate RSI in MS Excel
- Basic trading strategies using RSI
- Combining RSI with price tools
- Modifying RSI settings on FYERS Web
- What is RSI?
- How is RSI calculated
- How to calculate RSI in MS Excel
- Basic trading strategies using RSI
- Combining RSI with price tools
- Modifying RSI settings on FYERS Web
RSI Webinar 2: Advanced Trading Strategies
- Bullish and bearish divergence
- Bullish and bearish failure swing
- Positive and negative reversal
- RSI bull market and bear market zone
- Identifying trend shifts using RSI zones
- Bullish and bearish divergence
- Bullish and bearish failure swing
- Positive and negative reversal
- RSI bull market and bear market zone
- Identifying trend shifts using RSI zones
To learn in detail about Technical Analysis & other areas of financial markets, consider visiting FYERS School of Stocks.
To visit School of Stocks, click here: fyers.in/school-of-stoc…
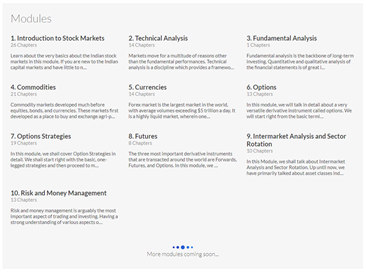
The snapshot below shows the modules we have covered in School of Stocks
To visit School of Stocks, click here: fyers.in/school-of-stoc…
The snapshot below shows the modules we have covered in School of Stocks
• • •
Missing some Tweet in this thread? You can try to
force a refresh


