,
79 tweets,
21 min read
Read on Twitter
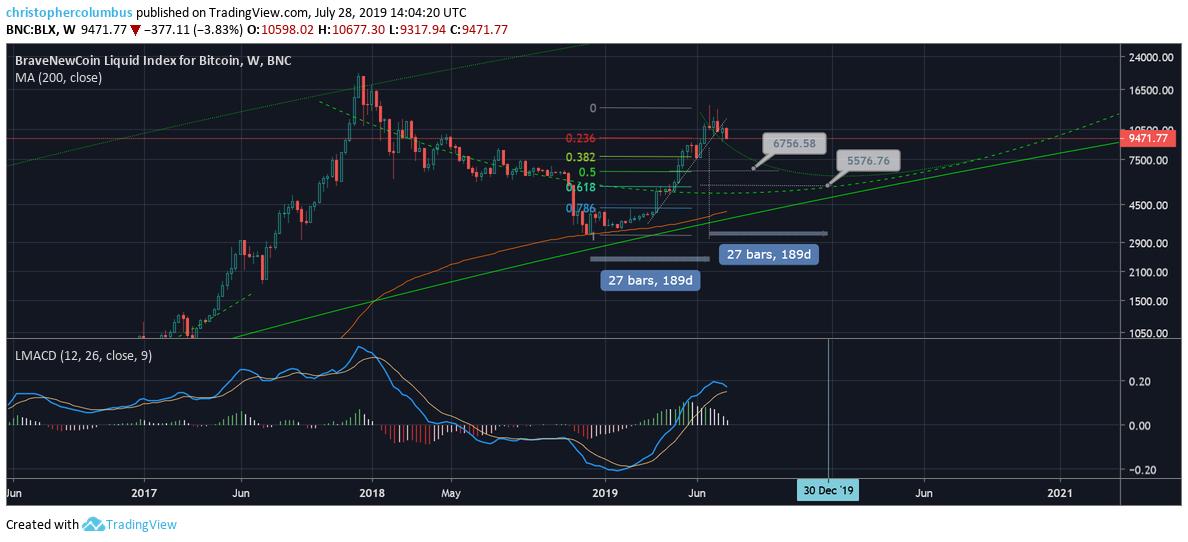
If the correction is as long as the parabolic rise, looking at the end of the year. 

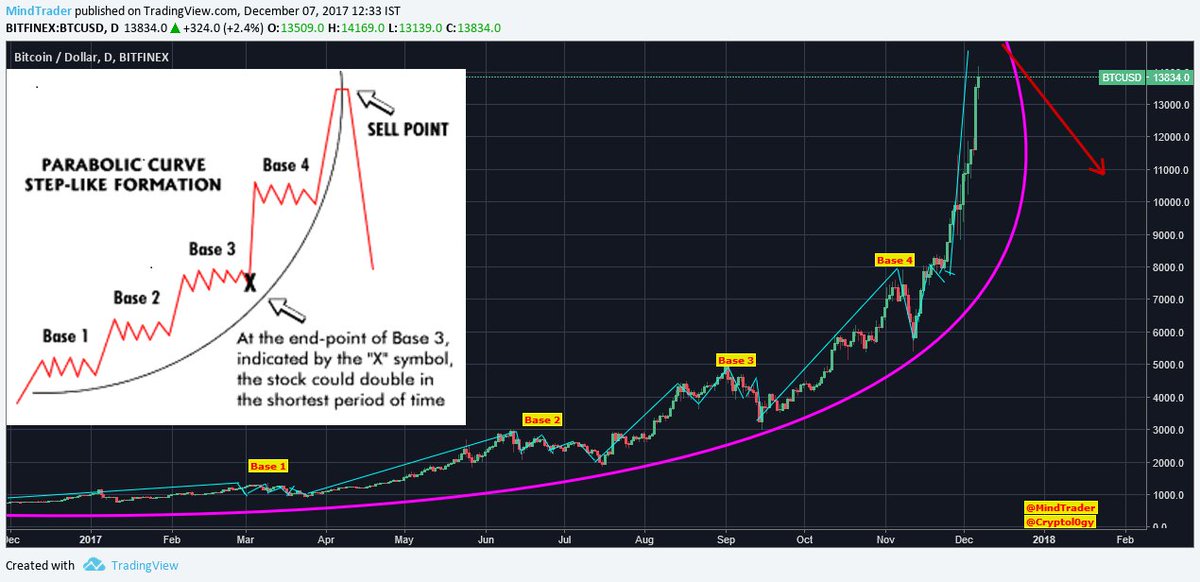
Short term prediction on the basis of a comparison between the parabolas.
Bounce to 10K then down to7K range.
Bounce to 10K then down to7K range.

Takeaways for the hodler/ investor:
- the moving averages have bottomed earlier, and should never go as low
- 100 MDA should re-cross the 200MDA
- price briefly through the 200 MDA, then acts as support
- solid support with the 200 WMA.
- DCA if no core position
- the moving averages have bottomed earlier, and should never go as low
- 100 MDA should re-cross the 200MDA
- price briefly through the 200 MDA, then acts as support
- solid support with the 200 WMA.
- DCA if no core position
From two weeks ago. My main outlook for this correction.
Going forward, will use this thread to map out the correction. I think many will be surprised how low the price could go... but then this is the correction of a parabolic rise. Looking for a 50% correction, but keeping some powder dry should it drop a little lower.

Previous thread looking mapping out the top...
The bigger picture. Could it go this low? Yes. Will it? No certainty, so DCA as usual. Anything but FOMO.


Price already 50% of the way to the 6K range....

OK, so we be at the business end of this correction. It may well have a lot further to go time-wise, but price-wise we could be looking at a big dip here next week. Buy target 7.5K, maybe even 6.5K. You'd expect a decent bounce and then another dip later on, and another buying op

Could be a case of playing the relatively long game here....
With lower lows being reached, the selling should pick up. Easy come easy go. No gain without pain etc.
The buyer could just about walk away for a few months....
The buyer could just about walk away for a few months....

Most are not looking for price to go this low, but then most are not using the log curve...

Same sideways movement seen before the second big dip....

Another test of the upper range....

With the longer trend in mind, the test of the upper range should be read as 'bait and switches'. The get people bullish again [revival of FOMO] and then..... the predictable. The psychology is one of anxiety.
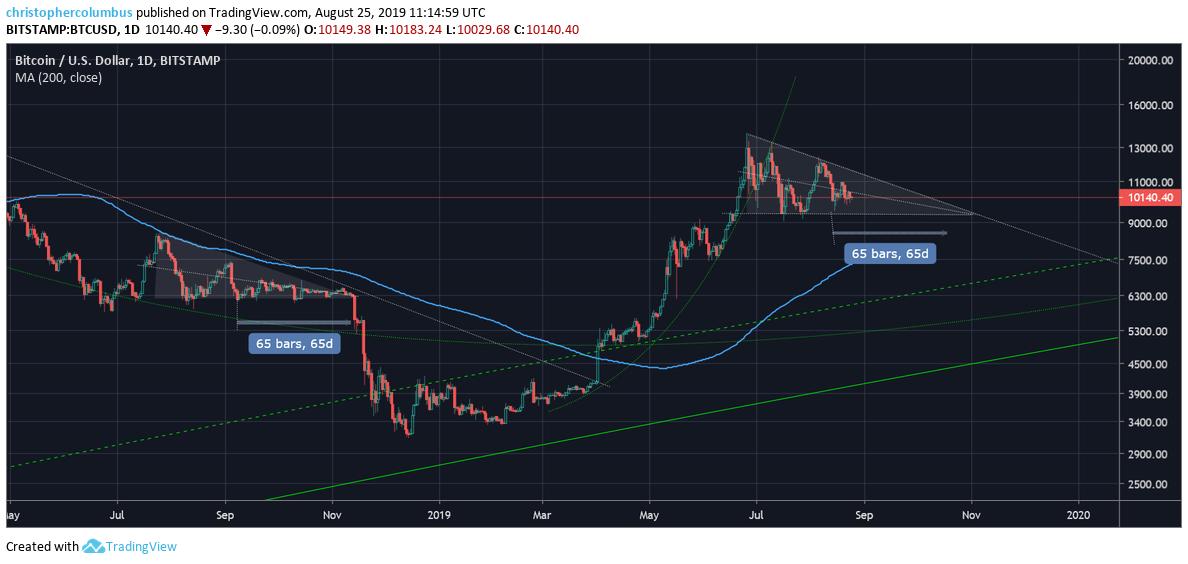
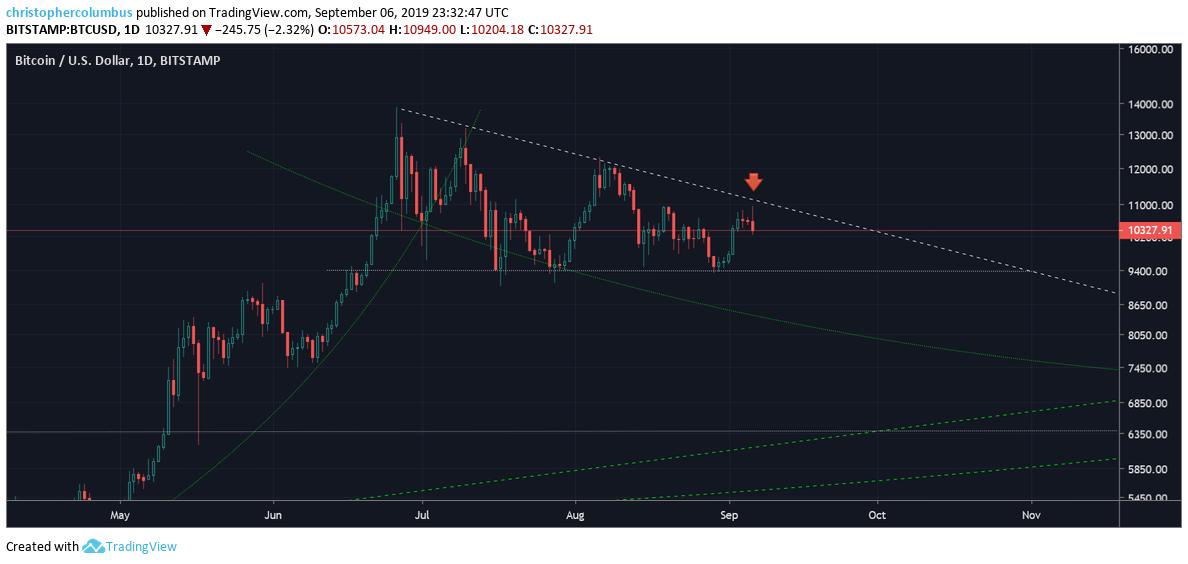
The dreaded descending triangle....

A descending triangle, in the course of the next week or so, would make sense in the medium term. A bounce at around 7.5K and then a further drop at a later date for a 50% correction. 61% is even on the cards, but buying at the 50% level/ averaging in would be safer...

Would start to get interesting if price made a higher high...

BTC at the crossroads....

Decisive week as reflected in the weekly MACD. Up or down?

Bounces typified by four or five days up...

Now is not the time to panic buy. Until price shows a decisive break from the previous correction, it's best to wait it out. Notice both time-wise and price-wise, this pattern is still within the parameters of the previous~
50% retracement is 11.2K~
Still no rush to buy. If you're going to pay top prices of 11K why not 12 or even 13K.. on a higher high or breakout. Still a good chance of a lengthy correction here.

Some impressive buying going on here. Question is whether it's FOMO or sustainable. If you've bought at lower levels, and are looking to buy at less frothy levels, then why not wait it out a few more days?
The point at which this theory of a continued correction would be invalidated would be when price was pushing a higher high at around 13K~

A few lines in the sand...

Certainly at the business end, the crucial test, for the idea of a correction. A full month of down to sideways with surely a decisive break one way or the other shortly.
Goes up, we do well, goes down we do well. As either way, the long term looks good~
Goes up, we do well, goes down we do well. As either way, the long term looks good~

Yup....

As far as an update on the fractal goes, this correction [assuming a further correction] looks not be as steep. This fractal may have run its course as with any comparisons they will break down at some point.

Possible descending triangle to take price into the 6K range~

200 MDA up in the 6K range now...
After being below the 200 MDA for over a year, you'd expect price to at least revisit it....
After being below the 200 MDA for over a year, you'd expect price to at least revisit it....


Hello, is that the daily MACD rolling over...

Still early days, but the down trend is starting to look likely...

Possibility of 8.5K in little over a week...

The fractal just keeps on giving...

If this chart scares you, you're probably doing something wrong. Either you're leveraged long, or you're a hodler putting too much significance on the daily price. No certainties, but a real possibility imo~

Daily MACD crossing bearish. All good for consolidation...

Back to four figures.
The parabola corrects, but at the time people get caught up in it, and the temporary hype. The inevitable hangover comes after the party. Stay sober people~~
The parabola corrects, but at the time people get caught up in it, and the temporary hype. The inevitable hangover comes after the party. Stay sober people~~

Half way to the 6K range already….


Thinking something like a slow grind down. Have to say, I'm a bit mystified by some of the short term bullishness I'm seeing on CT.

Even if BTC came back to the 6K range that would be a 100% gain over the course of this year! Not too shabby on the back of a major correction. People just been drinking too much of the kool aid if they're disappointed with that.🤪
And there we have it people. After a massive run on the weekly MACD, stretching right back to February, the MACD has finally re-crossed. This is signaling an extended consolidation, perhaps as long as through to the end of the year, in my opinion.

As long as price remains below the line, it's very much a buyers market - the prospective buyer can relax a little and look for lower prices.

As many weeks stalled at the top here as the parabolic run up out of the buy zone.

Looks like a possible descending triangle playing out. Would only start to consider invalidation of this with price at 11.6K....

Did people really think it was going to be that easy? I mean a 3x bounce up after a massive correction. This is Bitcoin....

Halfway there....

Bitcoin is volatile.
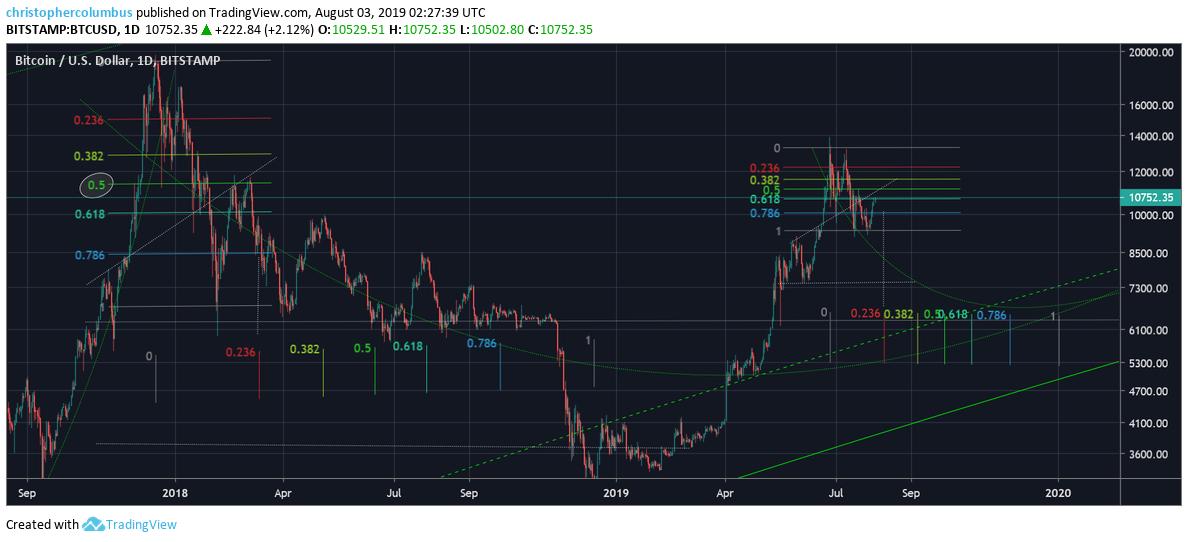
After a massive 300% spike, itself after a massive correction, it has barely corrected the first fib level....
After a massive 300% spike, itself after a massive correction, it has barely corrected the first fib level....

50 MDA turning over, and looking to cross the 200 MDA in September. Patient buyers may be well rewarded shortly...

Deja vu?
Momentum fizzling out. MACD starting to tell the story.
All good for consolidation and a sustainable rise in prices for this cycle up.
All good for consolidation and a sustainable rise in prices for this cycle up.

Unless you're wearing a set of moonboy blinkers, you're going to see something like this as a reasonable possibility.

The latest move in price looks to be confirming the technical pattern of the descending triangle. Odds are that we see a break soon and lower buying prices. All good for consolidation and a more sustainable run up in prices over the course of the next cycle.

Some buying targets.
7.5K looks well within striking range given a retracement to that level would be just over a third of the move up.
Even 6.5K looks within range, which would be a 50% retracement.
7.5K looks well within striking range given a retracement to that level would be just over a third of the move up.
Even 6.5K looks within range, which would be a 50% retracement.

Price coming back to the 'buy zone'...

Another 12 weeks should see the worst of it...

Could see another bounce up here, but weaker each time....

Got the bounce... which has lasted 8 days previously....


It's like TA works or something....🙂
Price targets that may come later in the month...

Looking precarious.....

Price looking weak here. This 2 month long chart/ thread may be coming to a head very shortly.
Good buying [not selling opportunity for those that didn't FOMO with dry powder~~~
Good buying [not selling opportunity for those that didn't FOMO with dry powder~~~

The unsugar-coated TA.
Gaussian channel on the daily.
Last time it turned red, price retraced the same percentage as measured from the bottom of the channel. As this parabola is not so extreme, may take more time~
Gaussian channel on the daily.
Last time it turned red, price retraced the same percentage as measured from the bottom of the channel. As this parabola is not so extreme, may take more time~

Possible break to another level shortly.

Daily MACD rolling over. Looks like an extended period of red on the histogram is due.
Weekly MACD signaling more to the downside...
Weekly MACD signaling more to the downside...


A correction to the 7K range looks well within the realms of real possibility...

Until there is some resolution of this, caution is called for....

Correction/ consolidation of the parabolic spike now longer than the parabolic spike itself....

Ideally, from a technical perspective based on my view of the log growth curve, I'd like to see something of a reverse head and shoulders play out along these lines....

One very rough quarter.... and then off to the races.
I hope we can all agree that it was a descending triangle now. First price target hit looking for the .05 level over the next few weeks or so.
I'd say a lot will be underwater now if they'd bought high. Now is the time to keep looking forward for the bottom and recovery.
I'd say a lot will be underwater now if they'd bought high. Now is the time to keep looking forward for the bottom and recovery.

If price manages to push down to 7.5K here, I'll be buying with a solid fraction of ear-marked funds....

Should the *investor* buy here?
There are a few moving parts to this question.
[Assuming you think BTC is in a long term secular bull market] do you already have a core position and want to add to it, or do you want to establish a position?
If the first, you can afford to wait
There are a few moving parts to this question.
[Assuming you think BTC is in a long term secular bull market] do you already have a core position and want to add to it, or do you want to establish a position?
If the first, you can afford to wait
… and start averaging in at lower levels
If the second, you could be averaging in now.
Given the change in momentum, I think people have most of this last quarter of 2019 to get positions in BTC established for the coming move up...
You will never get the exact bottom.
If the second, you could be averaging in now.
Given the change in momentum, I think people have most of this last quarter of 2019 to get positions in BTC established for the coming move up...
You will never get the exact bottom.
Strictly speaking, technically, 6.5K would be the best *potential* buy imo~