Time for a new thread now that the triangle's broken. Emphasis now shifting to bullish. Link to previous extended thread here
IDEAL, buying price 6.7K
Expect the 200 MDA to roll over then merge with the upward trending cyclical curve [green dotted line]
IDEAL, buying price 6.7K
Expect the 200 MDA to roll over then merge with the upward trending cyclical curve [green dotted line]

I can see I might have to develop some vocabulary to avoid confusion between time frames. How about colors?
Red - Stop don't buy
Orange - cautious zone, look for better entry points
Green - Full on bull
No prizes for guessing which zone we be in.😎
Red - Stop don't buy
Orange - cautious zone, look for better entry points
Green - Full on bull
No prizes for guessing which zone we be in.😎
Just to clarify.
As I'm not a day-trader, I consider the short/ immediate term can go either way/is random. From my perspective short term volatility is relatively unpredictable, and so I focus on the medium and the long term.
It's in this medium term that I am turning bullish
As I'm not a day-trader, I consider the short/ immediate term can go either way/is random. From my perspective short term volatility is relatively unpredictable, and so I focus on the medium and the long term.
It's in this medium term that I am turning bullish
...as the chart should depict, just as I was bearish in the medium term in the previous related thread that is linked. It should go without saying that I'm long term bullish in both.
The emphasis has changed because IF 6.7K happens to be the low, and IF it plays out in something like a reverse H&S, where that price is only briefly met, THEN the window of opportunity to buy may actually be quite small, perhaps only a month at sub 8K on the basis of this model

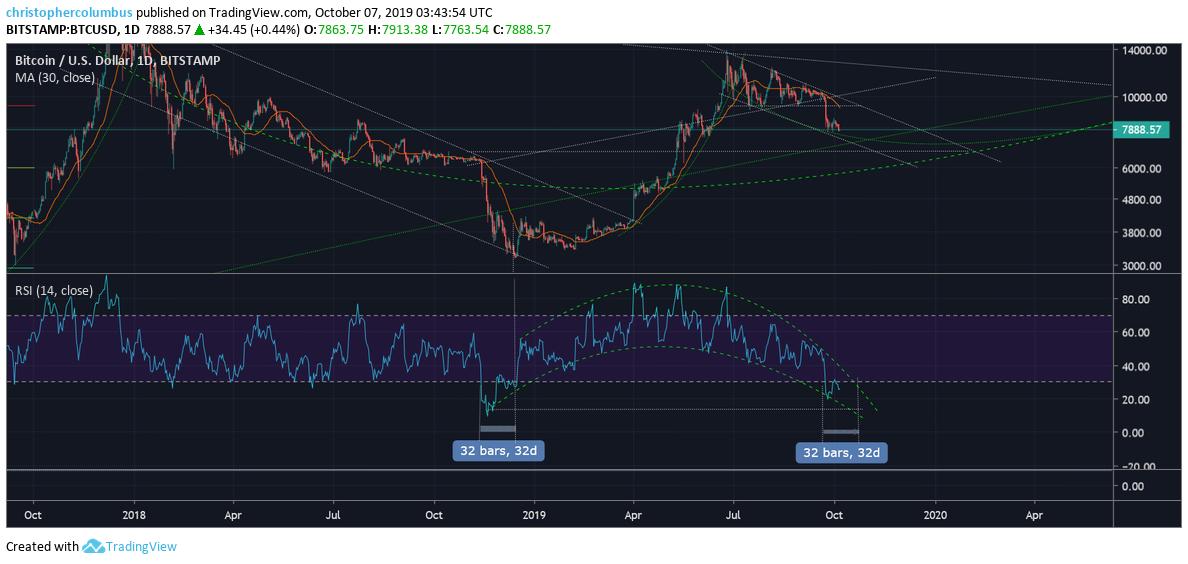
Gaussian on the daily.
More room to the downside suggested. Looking for the 0.5 level soon though perhaps a bounce and then the push down in a month or two. I don't think this correction will be as severe as the previous one for various reasons, plus plenty of support rising.
More room to the downside suggested. Looking for the 0.5 level soon though perhaps a bounce and then the push down in a month or two. I don't think this correction will be as severe as the previous one for various reasons, plus plenty of support rising.

Code orange - medium term bull.
Short term, bearish.
*Immediate term* - volatility considered random and so irrelevant for the investor and position trader.
Short term, bearish.
*Immediate term* - volatility considered random and so irrelevant for the investor and position trader.
I don't want to get too comfortable, and so remain open to alternatives. Hence the bullish balance of this thread.
*Bull hat mode on*
What IF the .38 level is the bottom. THEN you'd want to watch carefully to see if a consolidation/ ascending triangle forms here.
*Bull hat mode on*
What IF the .38 level is the bottom. THEN you'd want to watch carefully to see if a consolidation/ ascending triangle forms here.

Hmmm... some ratios...

I'm wary of drawing too strict a comparison between these two fib measurements [that BTC must correct to near 0.61] as price held up a higher level than previously.

Time fib comparison stretches out to the end of the year...

The real possibilities imo -
1] Price bounces here in the channel to form another descending triangle... final capitulation later in the year at the 0.50 level.
2] Price continues down the 7K range/ high 6K range then sideways.
1] Price bounces here in the channel to form another descending triangle... final capitulation later in the year at the 0.50 level.
2] Price continues down the 7K range/ high 6K range then sideways.
How long can it go, ideally, technically?
Why not keep it simple - 50% retracement, descending triangle target.
Why not keep it simple - 50% retracement, descending triangle target.

This target also happens to put it in the perfect position relative to the log growth curve and a lengthened cycle going forward...
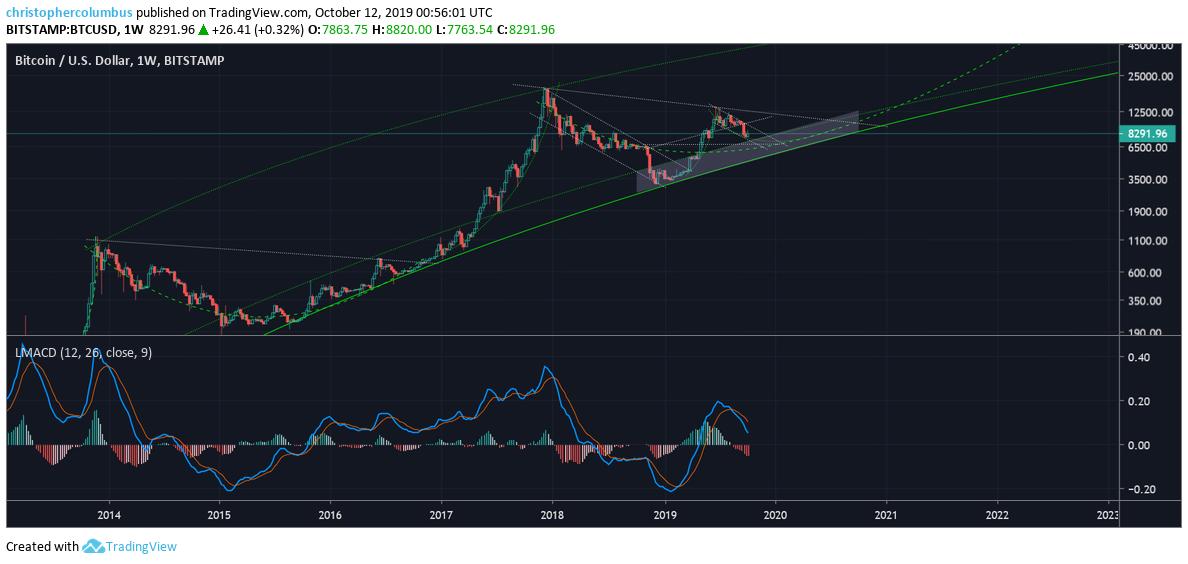
A bit of context on a larger time-frame, and a triangle that should break upwards.

Looks like a bounce it is. The standard TA here is support becomes resistance, which should also coincide with the downward line from the top.

RE some of the comments posted.
As far as I'm concerned the immediate/ short term in BTC is totally random [I don't have a crystal ball]. It's the medium term move that I'm 'more 'sure' of. I think BTC will go to the 6K range in the medium term, but various ways to get there
As far as I'm concerned the immediate/ short term in BTC is totally random [I don't have a crystal ball]. It's the medium term move that I'm 'more 'sure' of. I think BTC will go to the 6K range in the medium term, but various ways to get there
As I keep repeating ad nauseaum, I'm not a day-trader, so day-traders shouldn't be looking to use my charts. Now position traders and investors on the other hand....
Some room left to the downside though plenty of support gathering.

My outlook -
Long term - working assumption BTC will do well [hedged], and so charting redundant.
Short/ immediate term - completely random price movement, so charting redundant.
Medium term - medium term volatility toward long term price projection can be charted.
Long term - working assumption BTC will do well [hedged], and so charting redundant.
Short/ immediate term - completely random price movement, so charting redundant.
Medium term - medium term volatility toward long term price projection can be charted.
Of course though the short term is super-speculative, here is how BTC may get to the price target/ bottom over the course of the next two moths - another descending triangle.
had this in mind here also -
had this in mind here also -

Keep in mind people, this is only an ideal target. I'd be surprised if it actually/ exactly played out like this. If it did, it would be like hitting the trifecta - calling THE low, the premature parabolic rise, and THEN the correction of that parabola.🙂
Getting toward the business end now.
A *possible short term target* at previous support then back down to the target in the more *medium term target* of 6.7K.
'Possible short term target' is code for gamble if you must. Medium term targets are for the investor/ position trader.
A *possible short term target* at previous support then back down to the target in the more *medium term target* of 6.7K.
'Possible short term target' is code for gamble if you must. Medium term targets are for the investor/ position trader.

In the buy zone by Xmas….

I think it fair to say that the correction of this mini-parabola is supportive of the idea of lengthening cycles. The strength of a theory lies in its capacity to make predictions and to see those predictions confirmed. The idea of lengthening cycles looking solid.
I do not have a bear bias on Bitcoin [on the contrary, I am bullish]. What I do have is a model, and one I suggest that most are biased against [being too bullish on BTC]. This is why the log growth curve model remains unpopular [even though predictive of prices].
But then I count unpopularity a badge of honor. 🧐
Something to keep in mind - on the basis of the monthly Gaussian, always possible for prices to come back the channel as per last time. This would take prices as low as the 5K range....

This may seem a bit scary, but it also provides a ton of support. As prices break lower, you may hear a lot of people screaming 'bear market'.
Same retracement of the fib level on comparison of the parabolas gives 6.4K.

Further to go on the MACD?

This channel near coincides with my 6.7K target. A channel that is also seen in many other major alts [as charted in USD] .... though often on a different angle.

The bottom line of this channel just happens to stretch to my price target a few years out.😮

Yet another factor to think the 6K range will hold...

RSI on the daily spent a month in over-sold conditions last time. And even as the RSI started to recover, prices still pushed lower....
Just realized the last chart looks more bearish than it should be without support and price target drawn....

BTC may keep you guessing in the short term, but one thing is for sure - still in the downward channel.


Price poised above the buy zone. Weekly MACD coming back to equilibrium.
Looking for one more push down in the indicators...

Still in the channel - bounce or break?

Upward channel/ bear flag looks near broken. Perhaps a period of sideways before the next dip, where buying the dip might start making sense... as far as you still have dry powder left.


Resolution this quarter according to this fractal....

The half-expected bounce in the sideways channel.
This is why you don't want to be short term/ day trading this chart with leverage - it has the medium term time-frame in mind.
This is why you don't want to be short term/ day trading this chart with leverage - it has the medium term time-frame in mind.

Thinking one more dip this fourth quarter, and then off to the races....

How long in this band.....?

From a technical perspective, would prefer to see price continue to track sideways into the upper channels of the pitchfork. This would then set up nicely for the final push down...

Back into the 7K range after a week bounce. Could be all on here. Dry powder at the ready.

… for the alts.
Bought BTC previously at 6K, 3K and 4K [after selling a position at 10K].
Bought BTC previously at 6K, 3K and 4K [after selling a position at 10K].
Only another $700 to go for my buy target... but that is another 10% down here compared to say 5% at the top....

IDEAL price target.