Then we add fibs to suit the move on the 1H TF (15M TF shown here though)
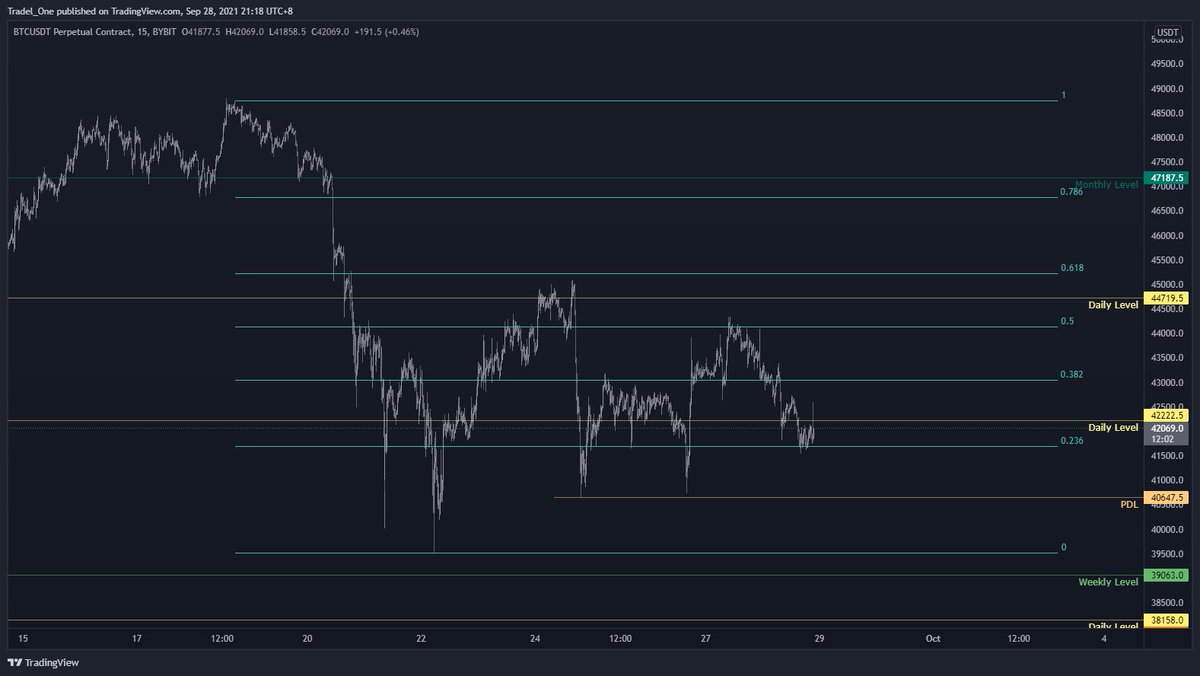
As we see how price is playing out, we pull our target fibs on the recent swing low to swing high, and see that the 0.705 level of the target fibs lines up nicely with the 0.236 1H HTF fibs
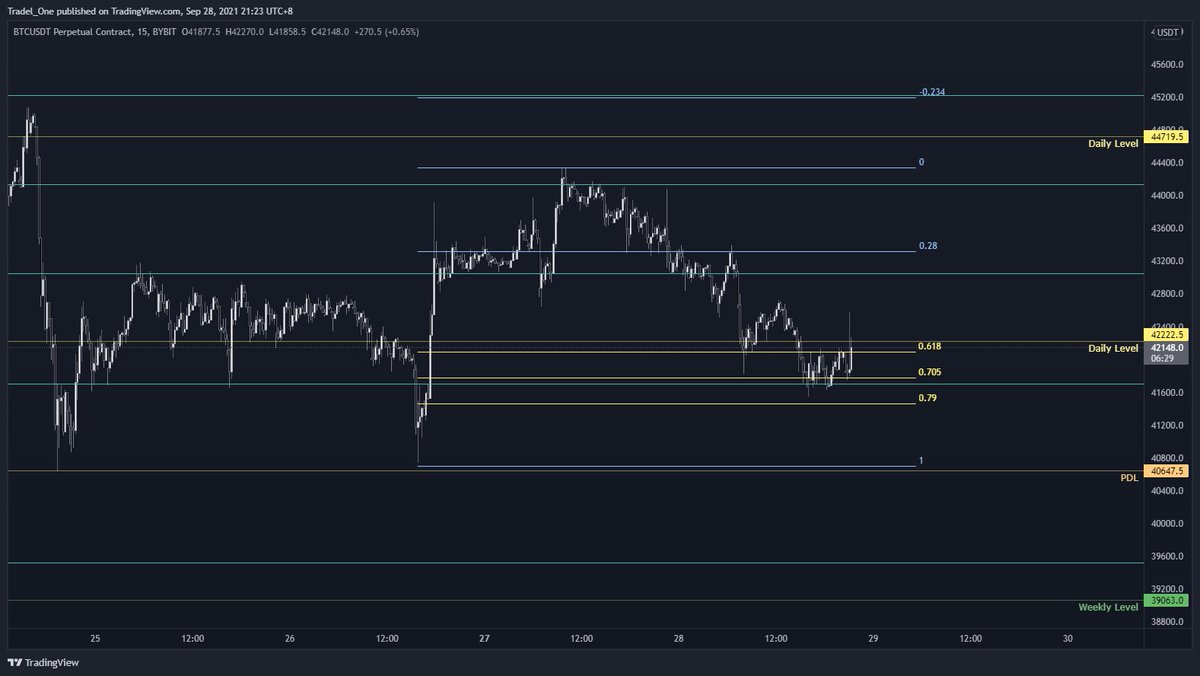
Dropping in at the 5M TF, we can pull our target fibs again to see where we'd enter a move (at the confluence levels we explored above)
If we then pull some target fibs in the opposite direction, this can give us some areas of possible trouble, or target tak profit areas
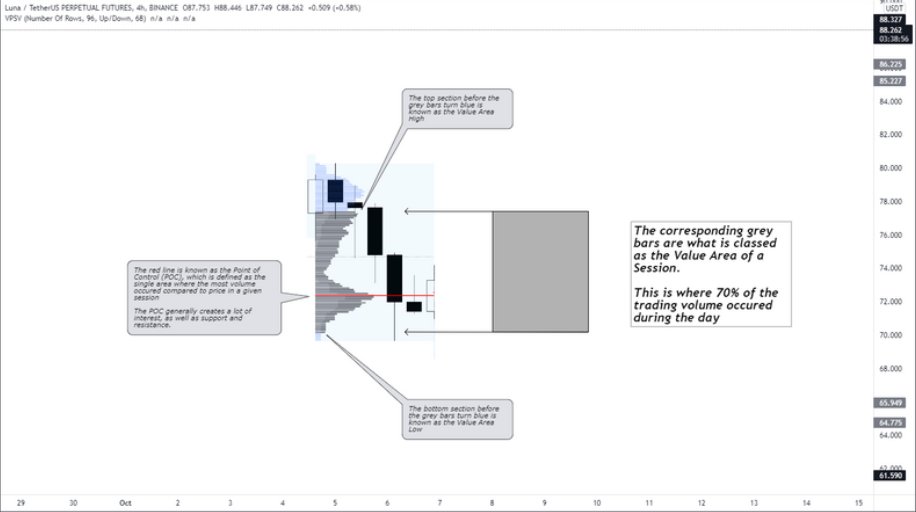
Also note that another factor of confluence was that price was trading at the Value Area Low of this region, which works well as a region to long.
Going back to our entry and long tool, you can see that our areas of trouble shown previously now line up with the -0.66 of our target fibs.
And? Well, lo and behold, we get an impluse move up and our targets are hit.
The same principles of the 5M chart can be used on a HTF chart, across any market.
Hopefully you can find some value in what I've shared here, and feel free to share.
Cheers,
Mindset ⚖️
• • •
Missing some Tweet in this thread? You can try to
force a refresh
Here's my 100 weeks of backtested $EURUSD price action from June 15 2020 to 09 May 2022, here's what is covered:
- Occurrence of high & low of the week
- % of high and low of the week per day
- % of Mondays high / low being swept on a given day
Took me a while, hope you enjoy
The high and low of the week
Here we can determine that the low of the week fell 38/100 times on a Mon, while the high of the week was also most likely to form on this day too with 31/100 occurrences
Note that there's during the week, there's more of a spread compared to $BTC
Percentage / Chance wise, you can see that Monday is more likely to be the low of the week by a factor of 5, 2, and 3 compared to a T, W, or Th respectively
Friday is different though.
With the high of the wk, Monday leads, followed by a Thurs, then Friday.
I made a free Price Action course not long ago - I'll share some detailed threads on portions of the course so you don't have to spend hours watching them when trading #Bitcoin & #Altcoins
We'll jump ahead to Module 4 - Ranges & Targets.
Why? Because I loved sharing this one!
What's in a Range?
A range is simply defined by anchoring two points on a chart based on:
A timeframe (daily, weekly, monthly etc)
Market structure
Or a combination of both
The method I use to anchor the range is a Fibonacci Tool, with values set at 1, 0.5, and 0
Range Tool Setup 1/1
1) First Select the 3rd item down on the left hand side menu
Then select "Fib Retracement"
2) Open up the settings of the Fib Retracement Tool, then set up the Fib tool to show the 0, 1, and 0.5 levels
The Trend Continuation fibs - covered in upcoming Module 3
Of course these are originally based on the ICT fibs, but nuanced per the following for #crypto & #bitcoin
- 0.72 entry point
- A negative 0.12 level
- 0.28 level
Why though?
The 0.72 Entry Point:
The reason for this is simple - it's the mid point of the 0.66 and 0.786 levels of the fib, where I've personally found much better entries and setups using this
The negative 0.12 level:
Included in this particular suite of fibs because you're looking for a get in, get out move that simply beats previous market structure.
By entering at the 0.72 level, this -0.12 level yields a 3RR move if the SL is at 1.
I backtested 100 weeks of $BTC #bitcoin price action from June 15 2020 to 09 May 2022, was able to determine the below:
- Occurrence of high & low of the week
- % of high and low of the week per day
- % of Mondays high / low being swept on a given day
8 hrs of research for you:
The high and low of the week
Here we can determine that the low of the week fell 43/100 times on a Mon, while the high of the week was also most likely to form on this day too with 27/100 occurrences
The rest of the days are generally similar, bar Tuesday lows & weekend highs
Percentage / Chance wise, it's obviously a no brainer in the fact that given the sample data of 100 weeks, that the % are simply a given of the numbers above