Good Morning!

If youve checked out my blog then you know I use What I call 'The neutral Strategy for ETF's.

I'm still very intrigued by the strength of $IWM.

Notice the Blueprint I put together on 9/26 and the results
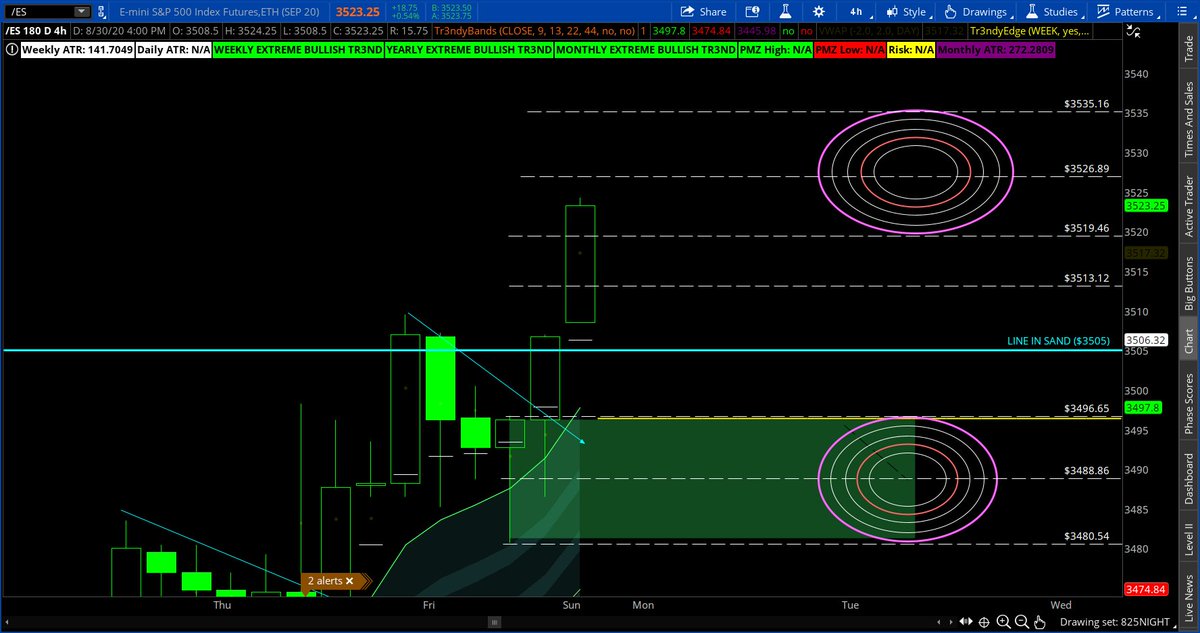
Price pushed into T2 to the upside and rejected and then dropped to lower T1 and supported. Remember levels to the upside are resistance and levels to downside are support. At the end of the week price closed right in the neutral and is getting very tight.
From a #Fibonacci perspective you can see price is still below the 618, the golden fib. Why is this a big deal? A move above the 618 signals a break in trend of the measured range.

Bulls need above 224.41 and a close on the weekly above this would be instrumental
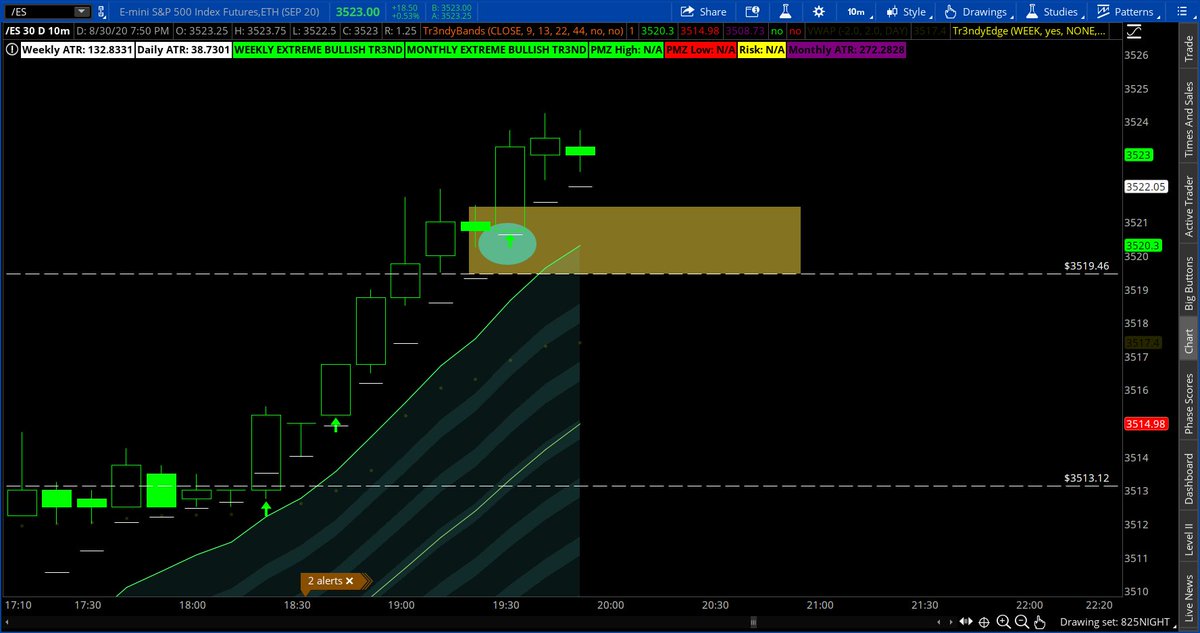
This week's blueprint I'm projecting a move over 223.91 then we can see a move in the upside. A move below neutral I'd expect support at the lower levels .

overall the Lows are getting higher and this past week #IWM Stayed very strong.

#Smallcaps are definitely on watch
Check out my blog when you have time to see more examples of my work and strategy at trendytrading.co/blog

#STocks #stockstowatch #StocksInFocus #Stockmarket $spy $qqq

• • •

Missing some Tweet in this thread? You can try to force a refresh
 

Keep Current with Tr3ndyjon

Tr3ndyjon Profile picture

Stay in touch and get notified when new unrolls are available from this author!

Read all threads

This Thread may be Removed Anytime!

PDF

Twitter may remove this content at anytime! Save it as PDF for later use!

Try unrolling a thread yourself!

how to unroll video
  1. Follow @ThreadReaderApp to mention us!

  2. From a Twitter thread mention us with a keyword "unroll"
@threadreaderapp unroll

Practice here first or read more on our help page!

More from @Tr3ndyJon

5 Oct
$SKEW #SKEW

What is it and why you need it in your #TRADINGTIPS

Values generally range from 100 to 150 where the higher the rating, the higher the perceived tail risk and chance of a 2 deviation event. A rating of 125 and below I'm looking for a big bounce 7-45 days out
Notice The $SKEW stayed in the upper range and the highest its ever been since MAY! You could say the Skew was skewed and most of us got skewed!
I have labeled this and used these levels for years now and honestly it can really help you get ready for the bigger sentiment changes
in the #StockMarket, this is a bigger picture and you can really see the value when placing a $SPY chart behind this. Notice the Purple chart shows when SKEW is high this will result in the Pull and when low results in Risk on!
Read 4 tweets
31 Aug 20
How to keep profits on #ES_F using Time-frame and 9 EMA

Please share, like and retweet

Step 1 have a process...Long over LIS into predefined targets
Step 2

locate what time-frame makes most sense to help you stay with trend using the 9 EMA but understand the higher the time-frame the more risk. we started with 9 EMA . In this case we are extended 23 points from the 9 ....too much!
Step 3-

What Time-frame fits your tolerance and your blueprint

In this case its the 15 min for me

It's confluent with the: Target, 9EMA and the Formation

ENjoy profits even if stopped and rest well for tomorrow

#StockMarket #LearnAndEARN #FuturesTrading $SPY $SPX
Read 7 tweets

Did Thread Reader help you today?

Support us! We are indie developers!


This site is made by just two indie developers on a laptop doing marketing, support and development! Read more about the story.

Become a Premium Member ($3/month or $30/year) and get exclusive features!

Become Premium

Too expensive? Make a small donation by buying us coffee ($5) or help with server cost ($10)

Donate via Paypal Become our Patreon

Thank you for your support!

Follow Us on Twitter!

:(