It is a top day for a top ten day...

We often do plots of the top emitters, especially for fossil CO₂ emissions. But, what about other GHGs? Is it the same distribution of top emitters?

We need a thread for that...

(I know about per capita, so no need to @ me)

1/
CO₂ emissions from net LUC (one bookkeeping model). These are net numbers, some countries are net sources, others net sinks.

Current LUC sources are concentrated in several developing countries (the rich countries cut their forests down long ago).

2/

agupubs.onlinelibrary.wiley.com/doi/full/10.10…
Don't over interpret the LUC numbers.

Different LUC datasets give different numbers. Here is the FAO data (from 2020). Indonesia is much less important in this dataset, Brazil dominates.

There is a lot of uncertainty at the country level, so be careful.

3/
Just to emphasise the uncertainty is large, here are several estimates at the global level. Uncertainty at the country level is much larger...

There are also major definition issues with LUC, which you can read about here carbonbrief.org/guest-post-cre…

Take care!

4/
Ok, if I add the fossil CO₂ emissions to the LUC CO₂ emissions, from Houghton and Nassikas, there are changes in ranking (Brazil and Indonesia mainly).

Just to note the obvious, this change is much less with the FAO data, so the ranking is not robust.

5/
Let's get to something easier...

The top 10 for CH₄ emissions. Many developing countries move up onto the top 10 list, indicating a much larger share of agriculture in their economies.

6/
Finally, N₂O emissions. Again, developing countries move up the list in comparison to CO₂ emissions.

7/
GHG emissions? You know that is misleading as the GWP is not such a good indicator of climate impacts?

But, here it is, without LUC, as that makes it more uncertain. Only the Top 6, and this is from the UNEP Emissions Gap Report 2020.

8/
By popular demand, here is GHG emissions per person, for the top 6 absolute emitters.

9/
The main point of this thread was to point out the differences with CH₄ & N₂O emissions, which gives more emphasis to developing countries.

Addressing CO₂ emissions from LUC is really hard. It is easy to download a dataset & plot, but this masks the huge uncertainties.

/10

• • •

Missing some Tweet in this thread? You can try to force a refresh
 

Keep Current with Glen Peters

Glen Peters Profile picture

Stay in touch and get notified when new unrolls are available from this author!

Read all threads

This Thread may be Removed Anytime!

PDF

Twitter may remove this content at anytime! Save it as PDF for later use!

Try unrolling a thread yourself!

how to unroll video
  1. Follow @ThreadReaderApp to mention us!

  2. From a Twitter thread mention us with a keyword "unroll"
@threadreaderapp unroll

Practice here first or read more on our help page!

More from @Peters_Glen

8 Oct
"Instead of leaving such work to volunteers, global institutions should marshal the funding & expertise to collect crucial data, & mandate their publication"

💯agree with @_HannahRitchie. No one wants to fund the giant who's shoulders we stand on.

1/

nature.com/articles/d4158…
The approach to science is to fund big models, expensive observations, etc. All this is needed, but somehow science seems to have forgotten the importance careful curation & maintenance of data.
2/
Science is full of projects that improve models, do model comparisons, process some satellite data, etc, & if you are lucky there might be a task that scrapes together some data to feed the models.
3/
Read 10 tweets
22 Sep
#ClimateTwitter Direct Air Capture (DAC)

In 2011, Rob Socolow estimated that 1MtCO₂/yr DAC would require a contact structure with height 10m & length of 5km.

Is that still the case?

1/

aps.org/policy/reports…
If I look at these pictures of Climeworks Orca via @EdgarHertwich

The height is ~3m, the length ~10m, & 4 units
Area: 120m² for 4000tCO₂/yr
Or: 30,000m² for 1MtCO₂/yr (120/4*1000)

If 10m high (Socolow), then contact structure ~3km long.


2/
This is rather crude, but is quite similar to the original Socolow estimate. If true, this is fascinating…

If contact structure is 10m high, then 1MtCO₂/yr requires 3-5km structure

1GtCO₂/yr requires 3-5000km
5GtCO₂/yr requires 15-25,000km

3/
Read 5 tweets
21 Sep
"Have you ever published a paper that *never* would have happened without twitter?" @dsquintana

Hmmm, certainly yes, & most of my papers are in some way influenced by Twitter, & five minutes on Twitter can generate lots of new paper ideas...

1/

Perhaps the most (in)famous climate paper in recent times only came about because @MLiebreich provoked 90% of #ClimateTwitter with #RCP85isBollox, laying the foundation for this paper with @hausfath & myself
nature.com/articles/d4158…
2/
I met @Oliver_Geden on Twitter, & we have written several papers together (& have many ideas that are waiting some time & resources).

I suspect the trouble paper with @KevinClimate was heavily influenced by debates on Twitter science.org/doi/abs/10.112…

3/
Read 7 tweets
16 Sep
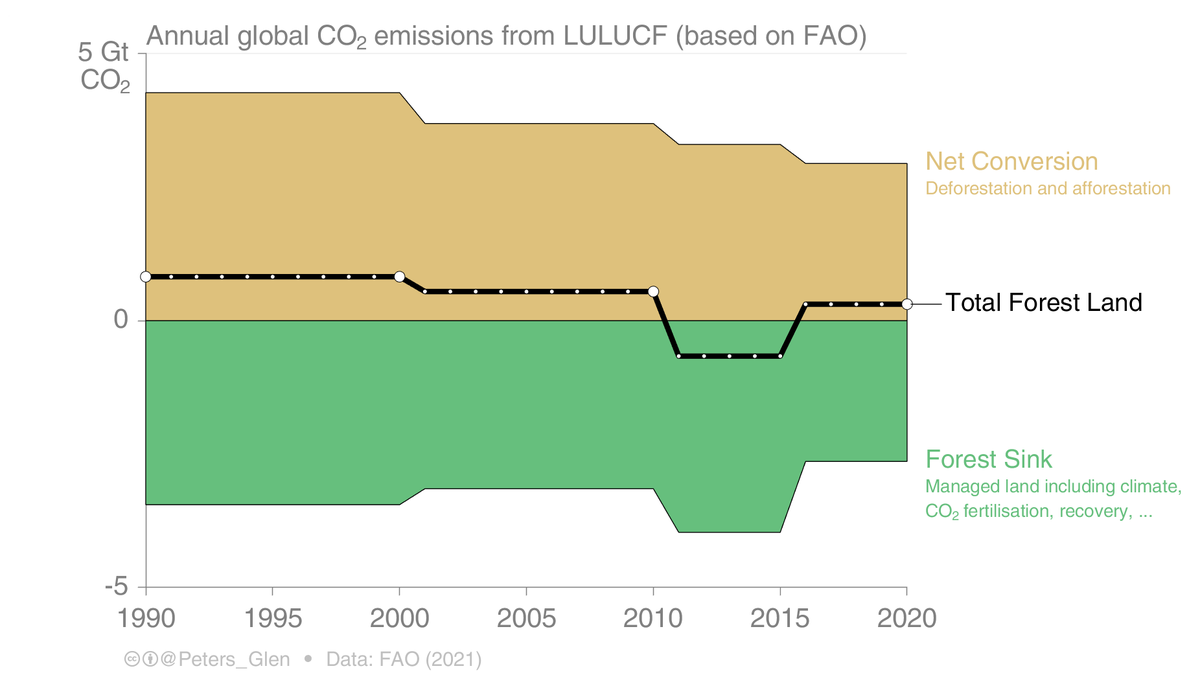
Estimating CO₂ emissions from forests is difficult, not least because of different definitions.

CO₂ emissions come from conversion (cutting down or growing a tree).

There is also a 'sink', soaking up CO₂ we previously emitted.

What should be reported as CO₂ emissions?

1/
It is really rather complex. The reason the 'sink' is included in emission accounting, is that it is difficult to determine what is 'anthropogenic'.

It was decided to use self-defined 'managed land' & include 'indirect' (climate) effects.

carbonbrief.org/guest-post-cre…

2/
Scientific studies (eg IPCC Assessment Reports) generally consider CO₂ emissions from 'Net Conversions' as the emissions, while government reporting to the UNFCCC combines the conversions & sink (black line).

The 'sink' is not the total sink, only a part of the forest sink.

3/
Read 6 tweets
14 Sep
Carbon Capture & Storage (CCS) in Canada.

There are two facilities (capturing in 2019), but very different stories:
* Boundary Dam: Operates ~60% capacity, used for EOR
* Quest: Operates ~90% capacity, permanent storage, but the generated H₂ is used to upgrade oilsands

1/
Boundary Dam is CCS on coal power, with the goal of capturing CO₂ for Enhanced Oil Recovery.

In short, it has not lived up to expectations. How much CO₂ gets stored is unknown, & in any case, the CO₂ is used for EOR (more CO₂).

2/

en.wikipedia.org/wiki/Boundary_…
Quest produces H₂ in a steam methane reformer, the concentrated CO₂ stream is captured & permanently stored.

Though, the H₂ is used to make heavy oil marketable, & in a sense, it is a type of EOR: the CO₂ is indirectly used to generate more CO₂.

3/

en.wikipedia.org/wiki/Quest_Car…
Read 4 tweets
13 Sep
Norway is known for its Carbon Capture & Storage (CCS) & is best in class.

Even the best in class does not run at capacity. Currently ~80% of capacity is used, but Sleipner has dropped to ~65%.

But, Norwegian CCS is the easy type, removing CO₂ from extracted gas.

1/
The extracted gas at Sleipner Vest contains ~9% CO₂, but has to be reduced to ~2.5% to meet sales specifications.

The extracted gas in the Snøhvit field contains ~5-7.5% CO₂, and this has to be removed to avoid it freezing out in the downstream liquefaction process.

2/
The CO₂ has to be removed for market or technical reasons. You would therefore expect the facilities to run at a high capacity, as they have to!

The CO₂ is captured & stored, presumably to avoid paying the Norwegian CO₂ tax. This is great, but a different issue.

3/
Read 8 tweets

Did Thread Reader help you today?

Support us! We are indie developers!


This site is made by just two indie developers on a laptop doing marketing, support and development! Read more about the story.

Become a Premium Member ($3/month or $30/year) and get exclusive features!

Become Premium

Too expensive? Make a small donation by buying us coffee ($5) or help with server cost ($10)

Donate via Paypal Become our Patreon

Thank you for your support!

Follow Us on Twitter!

:(