The new #SAT report is out.
- Every racial group had a large participation decline
- Every racial group had a composite SAT score rise, except Hispanics (who are categorized as a separate racial group) & those who did not respond on race
- Natives rose 24 points
- Asians rose 23
- Every racial group had a large participation decline
- Every racial group had a composite SAT score rise, except Hispanics (who are categorized as a separate racial group) & those who did not respond on race
- Natives rose 24 points
- Asians rose 23

Men dropped their #SAT participation 30%; their composite score rose 13 points.
Women dropped their participation 32%; their composite score rose 6 points.
Women dropped their participation 32%; their composite score rose 6 points.


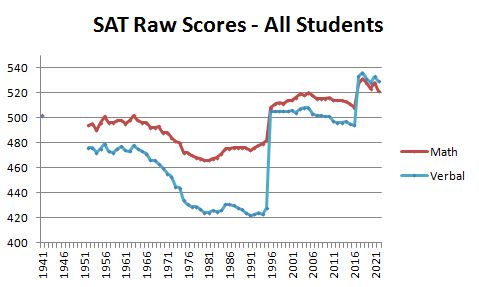
Here are the graphs for racial averages on the verbal portion of the SAT and the mathematics portion. These are raw scores, in the sense that there are no corrections for reforms that change the points scale.


2021 #SAT results show another jump in the score advantage of students whose parents completed a 4-year degree.
It's interesting that the advantage rises more over time for mathematics.
The 2016-2017 decrease was just an artifact of the test's reform.
It's interesting that the advantage rises more over time for mathematics.
The 2016-2017 decrease was just an artifact of the test's reform.

Largest one-year decreases in #SAT participation in percentage points:
Maine 68
West Virginia 51
Massachusetts 43
Colorado 42
California 40
Washington 40
Maryland 36
Oregon 31
Rhode Island 29
New Jersey 28
Michigan 27
Pennsylvania 25
Only increase in % points:
New Mexico 12
Maine 68
West Virginia 51
Massachusetts 43
Colorado 42
California 40
Washington 40
Maryland 36
Oregon 31
Rhode Island 29
New Jersey 28
Michigan 27
Pennsylvania 25
Only increase in % points:
New Mexico 12
The new #ACT report is out.
- Every racial group greatly decreased participation.
- Every racial group had lower ACT scores, except Native Americans, who had even composite scores with African Americans last year.
- Asians had flat scores, if the Pacific Islanders are excluded.
- Every racial group greatly decreased participation.
- Every racial group had lower ACT scores, except Native Americans, who had even composite scores with African Americans last year.
- Asians had flat scores, if the Pacific Islanders are excluded.

Here is a graph of #SAT and #ACT participation by racial groups. Many want to attribute score changes to participation changes, but these ACT participation declines are also substantial without score increases.

The #ACT (and #SAT) advantage from having educated parents is growing faster than the advantage from having high-income parents, but that advantage didn't dip much last year, like the SAT advantage of high-income parents did during the 2008 recession.

Largest one-year decreases in #ACT participation in percentage points:
Oklahoma -42
Arizona -36
New Mexico -33
Minnesota -32
Montana -30
South Carolina -26
Oregon -22
Iowa -21
Georgia -19
Vermont -19
Alaska -17
Only increase in % points:
North Dakota +6
Oklahoma -42
Arizona -36
New Mexico -33
Minnesota -32
Montana -30
South Carolina -26
Oregon -22
Iowa -21
Georgia -19
Vermont -19
Alaska -17
Only increase in % points:
North Dakota +6
I have been generating color-coded SAT-ACT composite score state maps that take participation levels into account. This year, #ACT and #SAT participation fell, while ACT scores also fell. The new map has moved nearly all states to the worst color on the scale that I have used.


One factor that could help general Asian dominance on the SAT has been the verbal-score slide over time, which the latest reform was supposed to address. It appears to have worked, since verbal scores have match math scores since then.

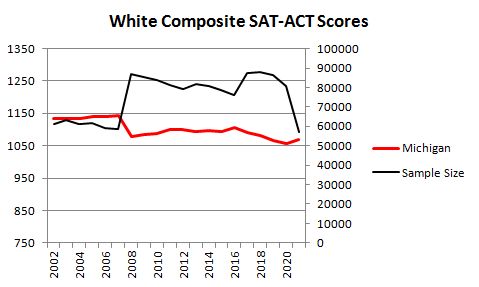
Over the past 20 years, for every racial group, except Native Americans, a "Harvard effect" caused average scores to rise the most in Massachusetts, compared to other states and Washington, DC.
Scores fell the most in Michigan for white students.
Scores fell the most in Michigan for white students.

At least until this year, the Harvard effect on composite SAT-ACT scores has appeared to be impervious to changes in total test participation.
(The left axis is for average composite scores. The right axis is for sample size of the students.)
(The left axis is for average composite scores. The right axis is for sample size of the students.)

Maybe participation changes help explain SAT-ACT average declines, but the effect isn't completely consistent. From 2000 to 2010, Detroit's population declined 25%, and it declared bankruptcy in 2013.
For African-American students, the state which most improved in average SAT-ACT composite scores was, once again, Massachusetts, and the worst decline was in Idaho.
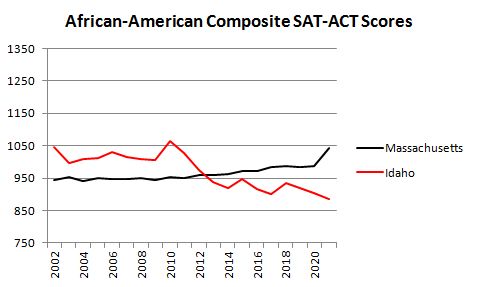
The African-American Harvard effect in Massachusetts has the same shape as the white Harvard effect, at a lower score range. Their participation fell off more abruptly this year.

Participation trends might have played a role in the state with the largest decline of African-American SAT-ACT scores, Idaho, but not a consistent one.

Hispanic-American students had their greatest SAT-ACT composite score increase in Massachusetts and their largest decline in Alabama.

Hispanic participation in the SAT and ACT varied widely in Massachusetts over the last 20 years, but the shape of the "Harvard effect" still appeared identical to that of white and African-American students.

SAT-ACT participation by Hispanic-American students did not decline this year in Alabama and their scores did not rise. This year's general decline in participation appear to have had a different impact on the type of students who take the exams than previous years.

Over the last 20 years, Asian students had their largest increase in average SAT-ACT composite scores in Massachusetts and their largest decrease in North Dakota.

The largest decline in the Harvard effect of rising average composite SAT-ACT scores for Asians in Massachusetts happened in 2017 with the latest SAT reform, which was also when their combined SAT & ACT participation dipped.

Composite SAT-ACT scores by race in Massachusetts over the last 20 years show that this "Harvard effect" is strongest for Asians & nonexistent for Native Americans. This is relevant to the #SFFA v #Harvard #SCOTUS case, in which #AffirmativeAction systemically targets Asians.

The largest decline for a state in composite SAT-ACT scores over 20 years among Asians, that which happened in North Dakota, does seem to have its worst periods of decline largely coinciding with increased participation.

Native-American SAT-ACT scores improved the most in Pennsylvania, which was a weaker improvement than other racial groups in Massachusetts.
Their biggest drop & the biggest state average drop of any racial group was in Nevada, which has 28 reservations. (Zero in Pennsylvania.)
Their biggest drop & the biggest state average drop of any racial group was in Nevada, which has 28 reservations. (Zero in Pennsylvania.)

Perhaps Native-American SAT-ACT composite scores would have declined in their best improved state, Pennsylvania, if their participation had not declined.

Even with recent declines in SAT/ACT participation by Native Americans in the state with their greatest score decline, Nevada, their composite SAT-ACT scores continued to decline.

The @AP story on the #NativeAmericanCrisis was about Wyoming, which had a Native-American SAT-ACT decline almost as bad as the worst state, but it appears that only a small percentage #NativeAmerican Wyomingites live on reservations.
https://twitter.com/UnsilencedSci/status/1191230212207333376

Only 20-30% of #NativeAmericans, in general, do live on reservations. States with the highest percentage on reservations (shown here with redder and thicker lines) had chronically low Native-American scores. Only those in Washington, DC, usually did worse.
By region, the #NativeAmericanCrisis harmed #NativeAmericans on the West Coast the most. That was the group that used to have the highest SAT-ACT scores.

One could argue that drugs are causing a similar, but smaller scale, recent crisis for white people that is affecting scores in regions other than the West & East Coast.
Whites are different from other races in that they always had high SAT-ACT scores in the nation's capital.
Whites are different from other races in that they always had high SAT-ACT scores in the nation's capital.

Likewise, African-American students have had serious recent SAT-ACT score declines in regions other than the East Coast.

Hispanic SAT-ACT scores declined in every region with especially precipitous recent decline on the West Coast.

The rise in the average SAT-ACT scores for Asian students, by region, is strongest for the 3 contiguous states of the West Coast and absent from Alaska and Hawaii.

The lower scores of Pacific Islanders does not account for these regional differences completely, as this graph of Asian SAT-ACT scores without Pacific Islanders shows.

Pacific Islanders from each region have falling SAT-ACT scores, and the Hawaiians have the worst decline. #Hawaiian #PacificIslanders have a current average lower than any racial group in any region.

• • •
Missing some Tweet in this thread? You can try to
force a refresh