With every new WEO come a gazillion new ideas to reflect on and write about. This is no summary of the main points, but some of the data points I found particularly interesting. A thread on the @IEA WEO 2021:
First, we are witnessing a profound transformation in the geopolitics of energy. By 2050, the geopolitics of energy will mean critical minerals and hydrogen rather than oil and gas. This is what we will trade. This is a big part of what we will need to manage across borders.
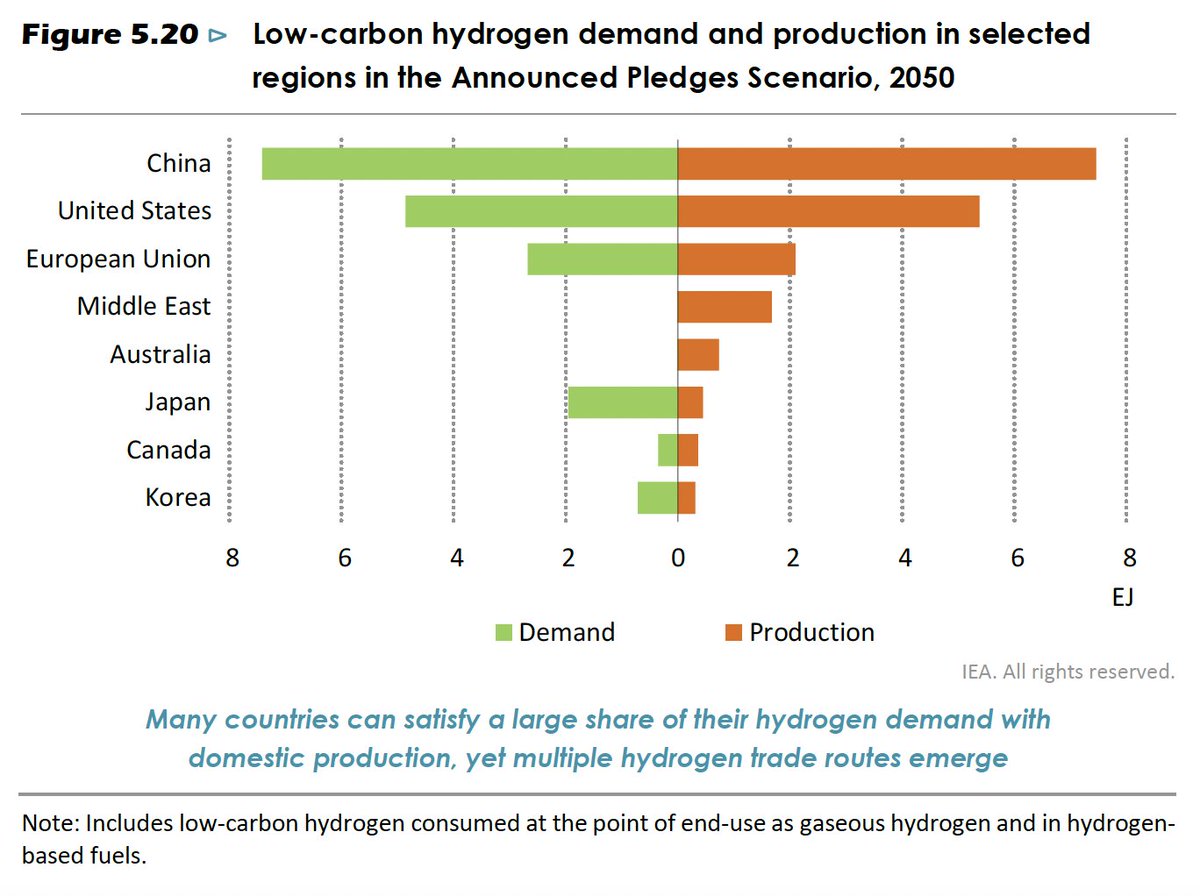
Having said that, the geography of hydrogen will not merely follow the geography of gas. It is too soon to speculate on trade routes for hydrogen by 2050, but this graph makes a key point: hydrogen trade routes will likely be limited. Think about hydrogen in its own terms.
Oil, gas and coal are far more diversified markets than many critical minerals. But this also begs a question: is there an inverse relationship between size and concentration? I think there is. The concentration problem will lessen over time. But only with our hard work.
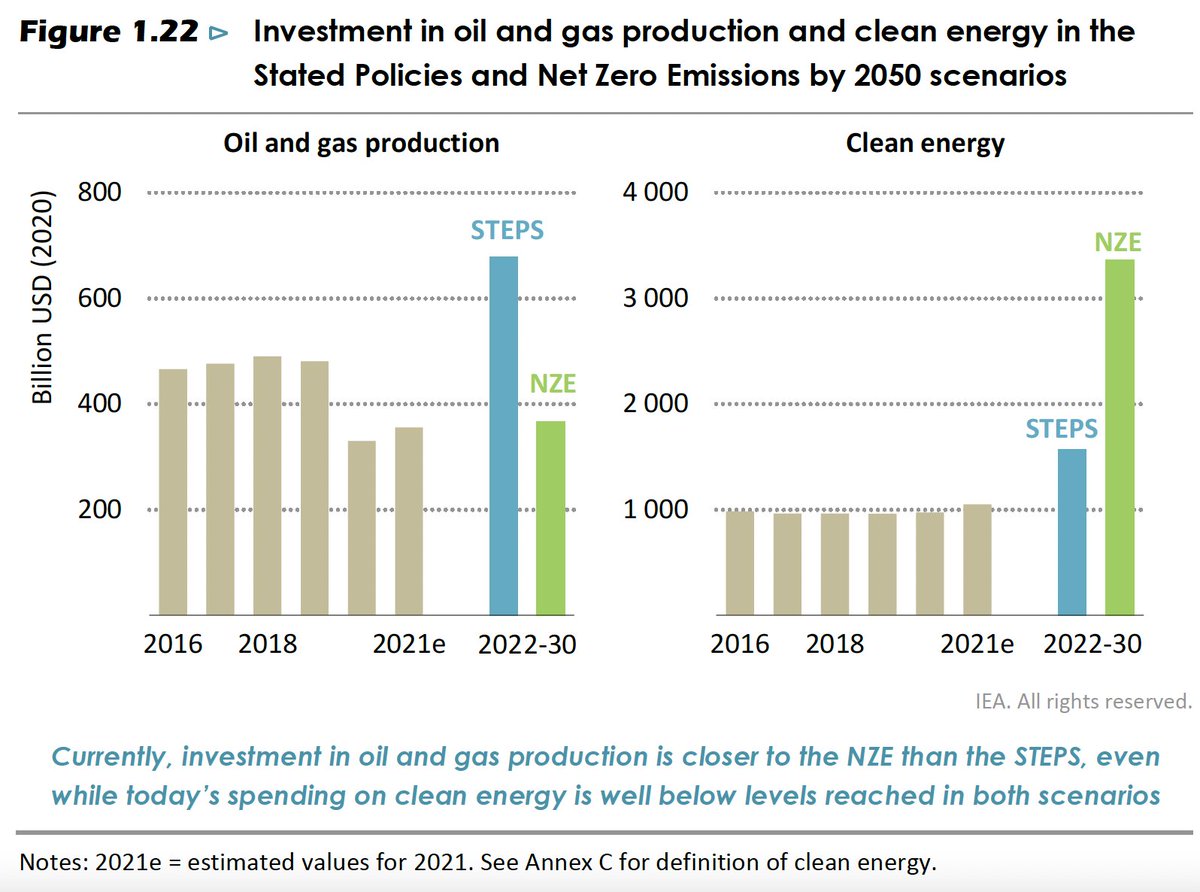
This chart also struck me. The scales are different so don’t rush to read it, but it makes a crucial point close to my heart: de-capitalizing oil and gas is not the same as capitalizing clean energy. Those are two distinct things. And the gap for clean energy is *huge*.
There are so many jobs associated with the energy transition. But there are also major job losses, often in different places. More than 4 million jobs in oil, gas, and coal lost by 2030 in a net zero path. An immense challenge for the just transitions community.
I couldn’t help but pause as this graph. We need nuclear to step up. Not just in emerging economies but in advanced economies too. And just to maintain what we have—to build new reactors. What a challenge.
This graph is also striking. Based on the news, it seems like the moment of hydrogen and CCUS. Yet when you look at the announced pledges versus the trajectory for a net zero world, there is a huge gap. We have barely started the hydrogen and CCUS journeys.
Finally, two images on water stress and physical infrastructure. It is an interplay we are only beginning to fully digest—and water is just one stressor. What we have is not secure for the world that’s coming. This is a map to print and put on one’s wall.
As ever, this is an immense piece of scholarship and the starting point for any serious discussion about what we need to do. So many ideas to come back to. Huge congratulations to @Laura_Cozzi_, @tim_gould_, and the whole @IEA team under @fbirol.
PS. Don't miss the IEA data visualization appreciation tweet:

• • •

Missing some Tweet in this thread? You can try to force a refresh
 

Keep Current with Nikos Tsafos

Nikos Tsafos Profile picture

Stay in touch and get notified when new unrolls are available from this author!

Read all threads

This Thread may be Removed Anytime!

PDF

Twitter may remove this content at anytime! Save it as PDF for later use!

Try unrolling a thread yourself!

how to unroll video
  1. Follow @ThreadReaderApp to mention us!

  2. From a Twitter thread mention us with a keyword "unroll"
@threadreaderapp unroll

Practice here first or read more on our help page!

More from @ntsafos

6 Oct
Gas is getting a lot of flak in today’s energy crisis—and for good reason. This is a genuine gas crisis. But the criticism can also miss a deeper truth: gas has a really tough assignment. The hardest, in fact. Let’s talk about *seasonal* balancing.
We often think of gas as balancing intermittent renewables, and sure it can do that. But its chief function in many modern economies is to manage seasonal variations in demand. And these can huge.
In the UK, for example, the winter/summer spread for gas demand is over 2x. For electricity the ratio is about 35 percent. This is fairly typical in countries where gas is used for space heating (in the U.S., the gas spread is about 75 percent, electricity about 35 percent).
Read 9 tweets
5 Jan
For years, I distrusted sidewalks. I grew up in Athens, where sidewalks are cramped, cracked, or just missing. I learned to walk on the street, something I had to “un-learn” after moving overseas. But I spent time in Athens recently, and it all came back. A thread—on sidewalks.
First rule: sidewalks are *not* for pedestrians. They function chiefly as overflow parking. If there is enough space on the sidewalk, a car or motorcycle will appear. Vehicles win—every time. (Photos taken around Alimos and Palaio Faliro.)
The next barrier is the trash can. The urban planner has often firmed its place on the sidewalk with this little insert. Good luck squeezing past these guys.
Read 10 tweets
8 Dec 20
Whenever I write about Turkey and the East Med, I get a gazillion replies with the same message: look at this MAP! So many problems can be traced to this map—and the feeling it is meant to create that Turkey is a victim in the East Med. Let’s talk about this map.
To begin with, it’s not really a map of “Greek claims in the eastern Med.” Greek officials do not show this map. In fact, they rarely show maps at all. You won’t find it in official documents. This map is a derivation; it is not an official, stated “claim.”
This map is an academic exercise about what a median-line approach to exclusive economic zones (EEZ) might look like. It is based on the idea that absent any agreement to the contrary, each island gets the full EEZ that it is entitled to by international law. That’s it.
Read 16 tweets
14 Sep 20
There is always so much interesting stuff in the @bp_plc energy outlook. Some thoughts on my main take-aways for natural gas. 🧵bp.com/en/global/corp…
At first glance, on slide 5, natural gas looks good: it overtakes coal by 2025 and oil by 2035; renewables surpass it in 2040, but even in 2050, gas is the largest fossil fuel. This supports the thesis that gas will do relatively better in the transition.
But these are percentages. In total consumption, gas defends its position in a rapid transition—growing a bit, then declining a bit. But in a "net zero" world, gas demand is near its peak already. By 2050, consumption is down by a third.
Read 8 tweets
11 Sep 20
The idea that the current tensions in the East Med are due to “decades-old” disputes isn’t entirely right. I am not sure people appreciate how much the Turkey-Libya delimitation created new realities and claims. Let's look at some maps.
My go-to source is always @CErciyes—his slides are excellent and make clear the Turkish position (I’ve added some links at the end of this thread). There is also a certain rhythm to his presentations, which makes them easier to compare over time.
Here is a map from May 2019, before the Turkey-Libya delimitation, showing Turkey’s claimed Continental Shelf. It uses the Turkey-Egypt midpoint and assumes that Kastellorizo has no or reduced effect. It reaches the 28º meridian, and then the firm line becomes a dotted line.
Read 12 tweets
19 Aug 20
So many bad takes on what is going in the East Med, what countries are fighting over, and how energy fits in. The narrative “tensions over energy” is neat, simple—and mostly wrong. Let's break it down.
There are two conflicts: one over Cyprus, the other over the role of islands in determining maritime boundaries, continental shelves, exclusive economic zones (EEZ), etc. And each conflict subsumes several sub-conflicts.
First, Cyprus. Turkey is frustrated by the Republic of Cyprus’ (RoC) hydrocarbon activities; it disputes the right of the RoC to declare EEZs, to issue licenses, to exploit resources, to spend the revenue, etc. This dispute has nothing to do with sea boundaries.
Read 21 tweets

Did Thread Reader help you today?

Support us! We are indie developers!


This site is made by just two indie developers on a laptop doing marketing, support and development! Read more about the story.

Become a Premium Member ($3/month or $30/year) and get exclusive features!

Become Premium

Too expensive? Make a small donation by buying us coffee ($5) or help with server cost ($10)

Donate via Paypal Become our Patreon

Thank you for your support!

Follow Us on Twitter!

:(