𝗖𝗧𝗠 #𝗕𝗧𝗖 𝗢𝗻-𝗖𝗵𝗮𝗶𝗻 𝗠𝗲𝘁𝗿𝗶𝗰 𝗗𝗮𝘀𝗵𝗯𝗼𝗮𝗿𝗱: 𝗪𝗲𝗲𝗸 𝟰𝟬 '𝟮𝟭
𝗣𝗲𝗮𝗸 𝗜𝗻𝗱𝗶𝗰𝗮𝘁𝗼𝗿𝘀 (𝟭𝟭 this wk)
TLDR: BTC hasn't peaked or is in its bear phase.
The 30D MA metrics, RHODL, & NUPL indicate that BTC has exited #CTM Wave 1* low & onto Wave 2*.
*👇
𝗣𝗲𝗮𝗸 𝗜𝗻𝗱𝗶𝗰𝗮𝘁𝗼𝗿𝘀 (𝟭𝟭 this wk)
TLDR: BTC hasn't peaked or is in its bear phase.
The 30D MA metrics, RHODL, & NUPL indicate that BTC has exited #CTM Wave 1* low & onto Wave 2*.
*👇

𝟭 𝗕𝘂𝗹𝗹 𝗣𝗵𝗮𝘀𝗲 𝗧𝗼𝗽 & 𝗕𝗲𝗮𝗿 𝗣𝗵𝗮𝘀𝗲 𝗕𝗼𝘁𝘁𝗼𝗺
𝟭𝗮. 𝗧𝗼𝗽 𝗖𝗮𝗽 𝗠𝗼𝗱𝗲𝗹
This model is based on Willy Woo's Top Cap Model for tracking the peak & the bottom tracker is based on #BTC's moving average price.
BTC has neither peaked nor is it in a bear phase.
𝟭𝗮. 𝗧𝗼𝗽 𝗖𝗮𝗽 𝗠𝗼𝗱𝗲𝗹
This model is based on Willy Woo's Top Cap Model for tracking the peak & the bottom tracker is based on #BTC's moving average price.
BTC has neither peaked nor is it in a bear phase.

𝟭𝗯. 𝗙𝗶𝗯 𝗠𝘂𝗹𝘁𝗶𝗽𝗹𝗶𝗲𝗿𝘀
This model is based on Fib retracement & extension numbers as multiples of the 350D SMA of #BTC's price.
BTC has neither peaked nor is it in a bear phase.
This model is based on Fib retracement & extension numbers as multiples of the 350D SMA of #BTC's price.
BTC has neither peaked nor is it in a bear phase.

𝟮. 𝟲𝟬-𝗗𝗮𝘆 𝗩𝗼𝗹𝗮𝘁𝗶𝗹𝗶𝘁𝘆: 𝗖𝗼𝘂𝗻𝘁𝗱𝗼𝘄𝗻 𝘀𝘁𝗮𝗿𝘁𝗲𝗱? No.
When 60D VVOL crosses V2 again, #BTC is expected to peak within 60 days. This hasn't happened yet.
* Please read 2(i)(a) of pinned tweet about using the 60D VVOL metric for determining BTC cycle tops.
When 60D VVOL crosses V2 again, #BTC is expected to peak within 60 days. This hasn't happened yet.
* Please read 2(i)(a) of pinned tweet about using the 60D VVOL metric for determining BTC cycle tops.

𝟯. 𝗨𝗦 𝗜𝗻𝘀𝘁𝗶𝘁𝘂𝘁𝗶𝗼𝗻𝗮𝗹 #𝗕𝗧𝗖 𝗣𝘂𝗿𝗰𝗵𝗮𝘀𝗲 𝗣𝗮𝘁𝘁𝗲𝗿𝗻 (>𝟬.𝟬𝟬𝟱𝟯)
No.
* Please read 2(ii)(e) of pinned tweet for details about this metric to determine BTC topping pattern & whether cycle peak is imminent.
No.
* Please read 2(ii)(e) of pinned tweet for details about this metric to determine BTC topping pattern & whether cycle peak is imminent.

𝟰𝗮. 𝗠𝗩𝗥𝗩-𝗭 𝗦𝗰𝗼𝗿𝗲 (>𝟳.𝟱): 𝗡𝗼
10/10/21 Value: 2.3*
*This is similar to that when #BTC was on #CTM Wave 1 in the 2013 bull phase.
For BTC to be in a bear phase, MVRV-Z Score will go to the pink zone & then trend down.
10/10/21 Value: 2.3*
*This is similar to that when #BTC was on #CTM Wave 1 in the 2013 bull phase.
For BTC to be in a bear phase, MVRV-Z Score will go to the pink zone & then trend down.

𝟰𝗯. 𝗠𝗩𝗥𝗩-𝗭 𝗦𝗰𝗼𝗿𝗲 (𝟯𝟬-𝗗𝗮𝘆 𝗠𝗔) (𝗪𝗮𝘃𝗲 𝟱):
This metric seems to be entering Wave 5. This corresponds to that when #BTC has exited the #CTM Wave 1 low & onto Wave 2.
* BTC is neither in a bear phase nor has it peaked.
This metric seems to be entering Wave 5. This corresponds to that when #BTC has exited the #CTM Wave 1 low & onto Wave 2.
* BTC is neither in a bear phase nor has it peaked.

𝟱.𝟭-𝗬𝗿+ 𝗛𝗢𝗟𝗗 𝗪𝗮𝘃𝗲 (~𝟰𝟳%): 𝗡𝗼
10/10/21 Value: 54%
10/10/21 Value: 54%

𝟲𝗮. 𝗥𝗲𝘀𝗲𝗿𝘃𝗲 𝗥𝗶𝘀𝗸 (>𝟬.𝟬𝟮):𝗡𝗼
10/10/21 Value: 0.004*
No change, but the chart pattern is similar to that when #BTC was out of #CTM Wave 1 dip in the 2013 bull phase.
For BTC to enter its bear phase, Reserve Risk will go to the pink zone first & then trend down.
10/10/21 Value: 0.004*
No change, but the chart pattern is similar to that when #BTC was out of #CTM Wave 1 dip in the 2013 bull phase.
For BTC to enter its bear phase, Reserve Risk will go to the pink zone first & then trend down.

𝟲𝗯. 𝗥𝗲𝘀𝗲𝗿𝘃𝗲 𝗥𝗶𝘀𝗸 (𝟯𝟬-𝗗𝗮𝘆 𝗠𝗔) (𝗪𝗮𝘃𝗲 𝟱):
This metric seems to be entering Wave 5. This corresponds to that when #BTC has exited #CTM Wave 1 low & onto Wave 2.
* BTC is neither in a bear phase nor has it peaked.
This metric seems to be entering Wave 5. This corresponds to that when #BTC has exited #CTM Wave 1 low & onto Wave 2.
* BTC is neither in a bear phase nor has it peaked.

𝟳. 𝗥𝗲𝗮𝗹𝗶𝘇𝗲𝗱 𝗛𝗢𝗗𝗟 𝗥𝗮𝘁𝗶𝗼 (𝗥𝗛𝗥) (>𝟰𝟬𝗞): 𝗡𝗼
10/10/21 Value: 11471*
* RHR is similar to that when #BTC exited #CTM Wave 1 low & onto Wave 2 in the 2013 & 2017 bull phases.
For BTC to enter its bear phase, RHR will go to the pink zone & then trend down.
10/10/21 Value: 11471*
* RHR is similar to that when #BTC exited #CTM Wave 1 low & onto Wave 2 in the 2013 & 2017 bull phases.
For BTC to enter its bear phase, RHR will go to the pink zone & then trend down.

𝟴. 𝗥𝗲𝗮𝗹𝗶𝘇𝗲𝗱 𝗖𝗮𝗽 𝗛𝗢𝗗𝗟 𝗪𝗮𝘃𝗲𝘀 (𝟯𝗿𝗱 𝗪𝗮𝘃𝗲):
𝗪𝗮𝘃𝗲 𝟭
* It looks like RC HODL Waves has entered Wave 2 of the 3-Wave pattern & this will be accompanied by the next leg up in #BTC's bull phase.
𝗪𝗮𝘃𝗲 𝟭
* It looks like RC HODL Waves has entered Wave 2 of the 3-Wave pattern & this will be accompanied by the next leg up in #BTC's bull phase.

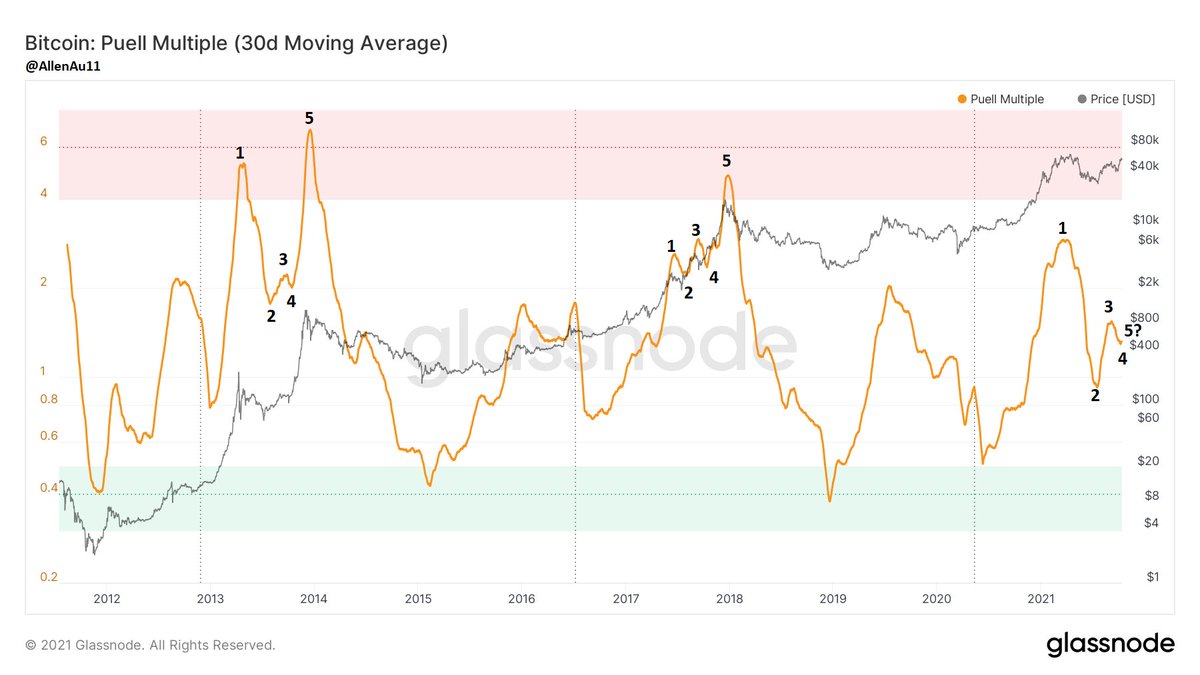
𝟵𝗮. 𝗣𝘂𝗲𝗹𝗹 𝗠𝘂𝘁𝗶𝗽𝗹𝗲 (>𝟰): 𝗡𝗼
10/10/21 Value: 1.57
For #BTC to enter its bear phase, Puell Multiple will go to the pink zone first & then trend down. This hasn't happened yet.
10/10/21 Value: 1.57
For #BTC to enter its bear phase, Puell Multiple will go to the pink zone first & then trend down. This hasn't happened yet.

𝟵𝗯. 𝗣𝘂𝗲𝗹𝗹 𝗠𝘂𝗹𝘁𝗶𝗽𝗹𝗲 (𝟯𝟬-𝗗𝗮𝘆 𝗠𝗔) (𝗪𝗮𝘃𝗲 𝟱):
This metric seems to be entering Wave 5. This corresponds to that when #BTC has exited #CTM Wave 1 low & onto Wave 2.
* BTC is neither in a bear phase nor has it peaked.
This metric seems to be entering Wave 5. This corresponds to that when #BTC has exited #CTM Wave 1 low & onto Wave 2.
* BTC is neither in a bear phase nor has it peaked.
𝟭𝟬. 𝗡𝗨𝗣𝗟 (𝗕𝗹𝘂𝗲): 𝗡𝗼 𝗘𝘂𝗽𝗵𝗼𝗿𝗶𝗮
10/10/21: 0.55 (Green)
The chart pattern is remarkably similar to that in the 2013 bull phase, exiting #CTM Wave 1 & onto Wave 2.
For BTC to enter a bear phase, NUPL will have to reach Euphoria first, but this hasn't occurred.
10/10/21: 0.55 (Green)
The chart pattern is remarkably similar to that in the 2013 bull phase, exiting #CTM Wave 1 & onto Wave 2.
For BTC to enter a bear phase, NUPL will have to reach Euphoria first, but this hasn't occurred.

• • •
Missing some Tweet in this thread? You can try to
force a refresh