𝗖𝗧𝗠 #𝗕𝗧𝗖 𝗢𝗻-𝗖𝗵𝗮𝗶𝗻 𝗠𝗲𝘁𝗿𝗶𝗰 𝗗𝗮𝘀𝗵𝗯𝗼𝗮𝗿𝗱: 𝗪𝗲𝗲𝗸 𝟰𝟬 '𝟮𝟭
Price Action Indicators (Fundamentals that affect BTC's price)
TLDR: 📈
1. Miner metrics- Bullish
2. Supply metrics- Bullish
3. Institution demand- Mod. Bullish
4. Network metrics- Bullish
Price Action Indicators (Fundamentals that affect BTC's price)
TLDR: 📈
1. Miner metrics- Bullish
2. Supply metrics- Bullish
3. Institution demand- Mod. Bullish
4. Network metrics- Bullish
𝟭. 𝗠𝗶𝗻𝗲𝗿 𝗠𝗲𝘁𝗿𝗶𝗰𝘀
a(i) The hash rate for #BTC miners continues to recover after the China mining ban. This has caused a global reshuffle of BTC mining hash rate such that the US has now emerged as the global leader in BTC mining as per the latest report from CCAF.
a(i) The hash rate for #BTC miners continues to recover after the China mining ban. This has caused a global reshuffle of BTC mining hash rate such that the US has now emerged as the global leader in BTC mining as per the latest report from CCAF.

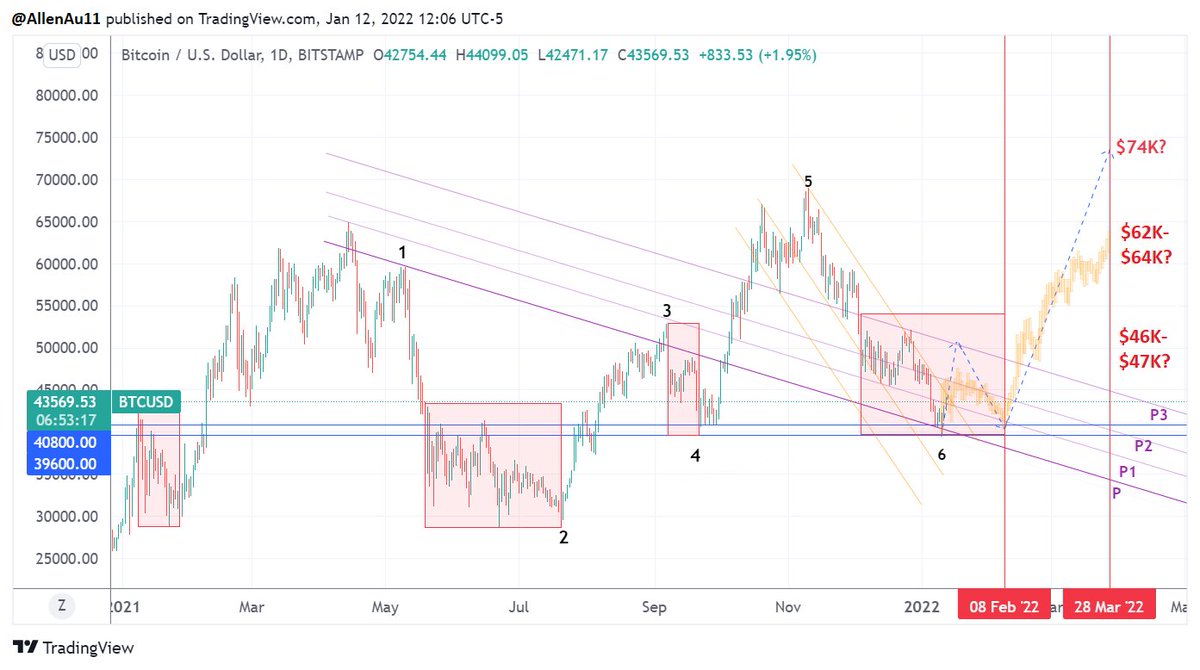
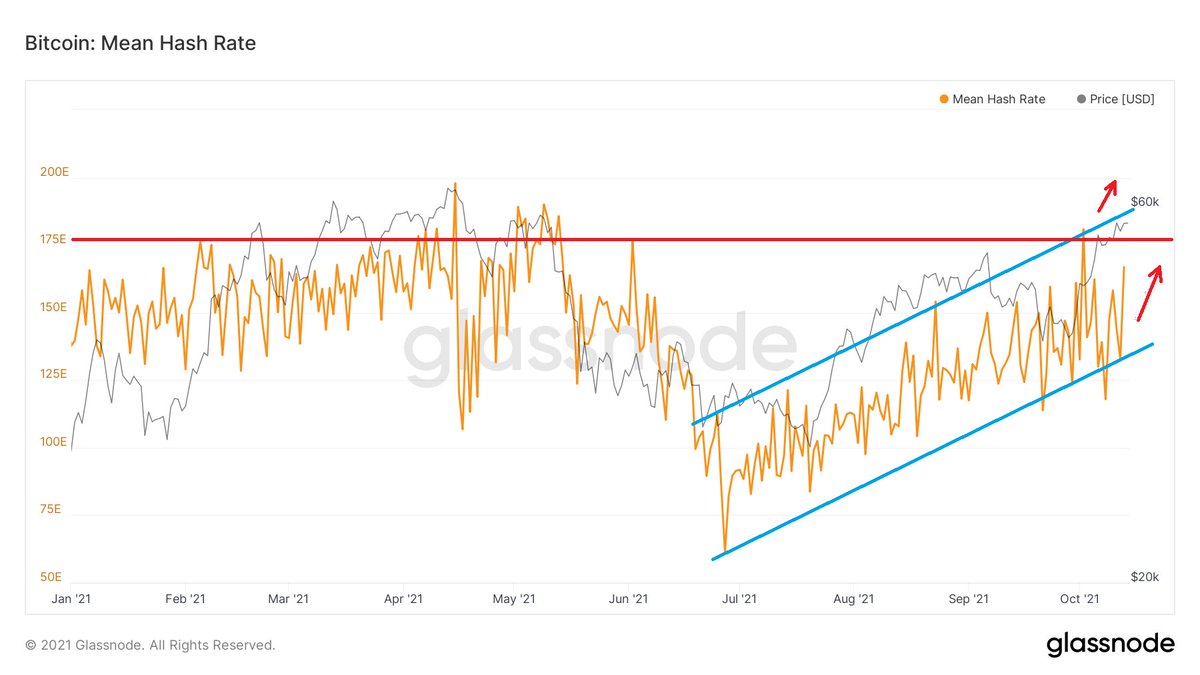
1a(ii) Technically, the #BTC hash rate forms an ascending channel. It challenged the key resistance level at 177E, which is also near the top of the channel, but got rejected. It's since recovered & is again on a run to challenge the resistance. Bullish!
1b(i) The Hash Ribbon is a market indicator that assumes that #BTC's price tends to reach a bottom when miners capitulate & that's when BTC's price momentum switches from negative to positive- a good buying opportunity.

1b(ii) The Hash Ribbon flashed buy signals twice during this bull phase & #BTC's price rallied by 1.5x-2.6x. Hash Ribbon buy signal was still intact last week.
If history repeats, this will put BTC between $61K-$106K!
If history repeats, this will put BTC between $61K-$106K!
1c(i) #BTC miner balance increased last week. The monthly change in miner's BTC balance is positive.
Weekly change: +279 BTC
Monthly change: +632 BTC
Bullish!
Weekly change: +279 BTC
Monthly change: +632 BTC
Bullish!
𝟮. 𝗦𝘂𝗽𝗽𝗹𝘆 𝗠𝗲𝘁𝗿𝗶𝗰𝘀
a(i) The Net #BTC Transfer Vol. to/from Exchanges (NTVE) is inversely correlated with BTC's price.
NTVE was net -ve last week & that helped BTC to rise >$57K.
This week, NTVE flipped from +ve to -ve & BTC corrected first & then rose to $58K.
a(i) The Net #BTC Transfer Vol. to/from Exchanges (NTVE) is inversely correlated with BTC's price.
NTVE was net -ve last week & that helped BTC to rise >$57K.
This week, NTVE flipped from +ve to -ve & BTC corrected first & then rose to $58K.

2a(ii) #BTC could still peak at $360K based on my pinned tweet under 2(ii)(c).

2b The balance of #BTC on Exchanges decreased last week. We saw BTC's price test the $56K level a number of times & finally broke through it on 10/11/21. It's now above $57K.
Weekly Change: -837 BTC
Monthly Change: -4044 BTC
Weekly Change: -837 BTC
Monthly Change: -4044 BTC

2c Last week, Whales sold 45454 #BTC. This explained why #BTC's price stalled at $56K. Their stash were all bought up by Great Whites & Fish. Tiger Sharks & Minnows took profits.
Early this week, Whales started buying again! This has helped BTC's price to break out & reach $58K.
Early this week, Whales started buying again! This has helped BTC's price to break out & reach $58K.

2d(i) The LT HODLers' #BTC supply falls as BTC's price ascends to its interim or cycle peak.
The current trend of old coins mimics the 2013 BTC bull phase- LT HODLers stacking sats before the cycle peak.
Last week, their BTC holdings set a new ATH of 12.1M coins. Still📈!
The current trend of old coins mimics the 2013 BTC bull phase- LT HODLers stacking sats before the cycle peak.
Last week, their BTC holdings set a new ATH of 12.1M coins. Still📈!

2d(ii) As #BTC has exited #CTM Wave 1 & onto Wave 2, the Spent Output Age Bands (SOAB) show that LT HODLers are holding onto most of their coins.
In 2013, SOAB continued to rise until the cycle peak. In 2017, it rose at first & then declined as BTC's rose to its cycle peak.👀
In 2013, SOAB continued to rise until the cycle peak. In 2017, it rose at first & then declined as BTC's rose to its cycle peak.👀

𝟯. 𝗜𝗻𝘀𝘁𝗶𝘁𝘂𝘁𝗶𝗼𝗻𝗮𝗹 𝗗𝗲𝗺𝗮𝗻𝗱
Last week, 32800 BTC or $1.7B worth of #BTC were withdrawn from Coinbase to cold storage. This is a 40% increase from last week, showing institutions were actively buying BTC as it hovered around $56K.
Last week, 32800 BTC or $1.7B worth of #BTC were withdrawn from Coinbase to cold storage. This is a 40% increase from last week, showing institutions were actively buying BTC as it hovered around $56K.

𝟰𝗮. 𝗡𝗲𝘁𝘄𝗼𝗿𝗸 𝗠𝗲𝘁𝗿𝗶𝗰𝘀
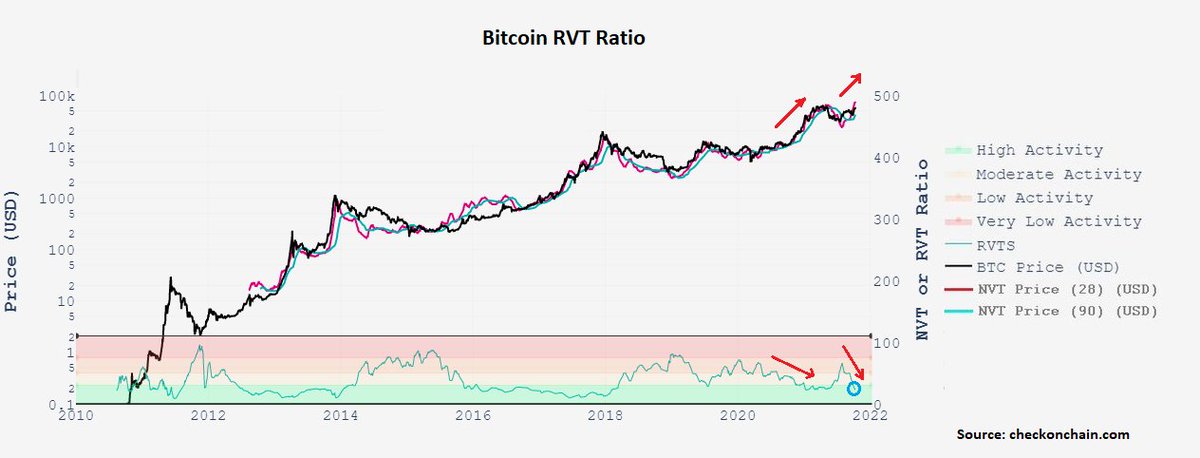
#BTC RVT Ratio is the realized market cap of BTC to transaction volume ratio.
RVTS (inverse of RVT Ratio) is finally in High Activity. If this continues, we should see BTC's price rally at least like it did when it rallied to its ATH.
#BTC RVT Ratio is the realized market cap of BTC to transaction volume ratio.
RVTS (inverse of RVT Ratio) is finally in High Activity. If this continues, we should see BTC's price rally at least like it did when it rallied to its ATH.
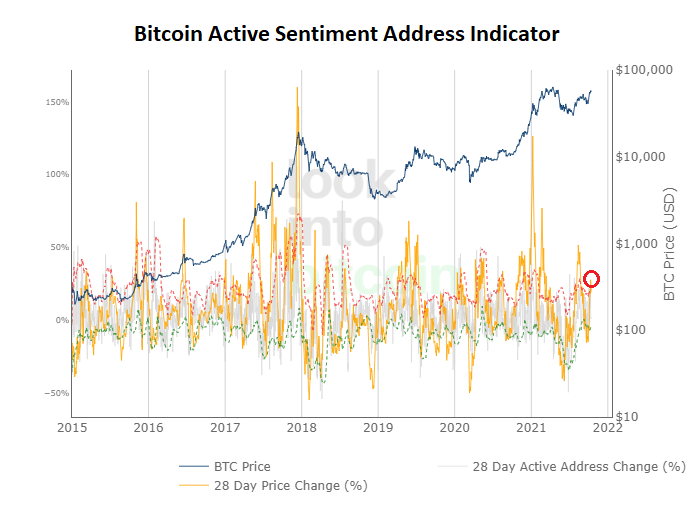
4b. The #BTC Active Address Sentiment Indicator broke above the red dotted line (upper std. dev. band of 28D active address change) on 10/11/21, but is now back below it. This shows that market sentiment was slightly overheated, but now back in check. BTC could rally a bit more.
• • •
Missing some Tweet in this thread? You can try to
force a refresh