Even if entire EU went net-zero today and stayed net-zero for the rest of the century
impact rather small, reducing temperature rise in 2100 by 0.14°C (0.25°F)
Because vast part of 21st-century emissions come from currently poor world
UN climate model live.magicc.org
impact rather small, reducing temperature rise in 2100 by 0.14°C (0.25°F)
Because vast part of 21st-century emissions come from currently poor world
UN climate model live.magicc.org

We don't have good estimates of what the EU net-zero policy will cost,
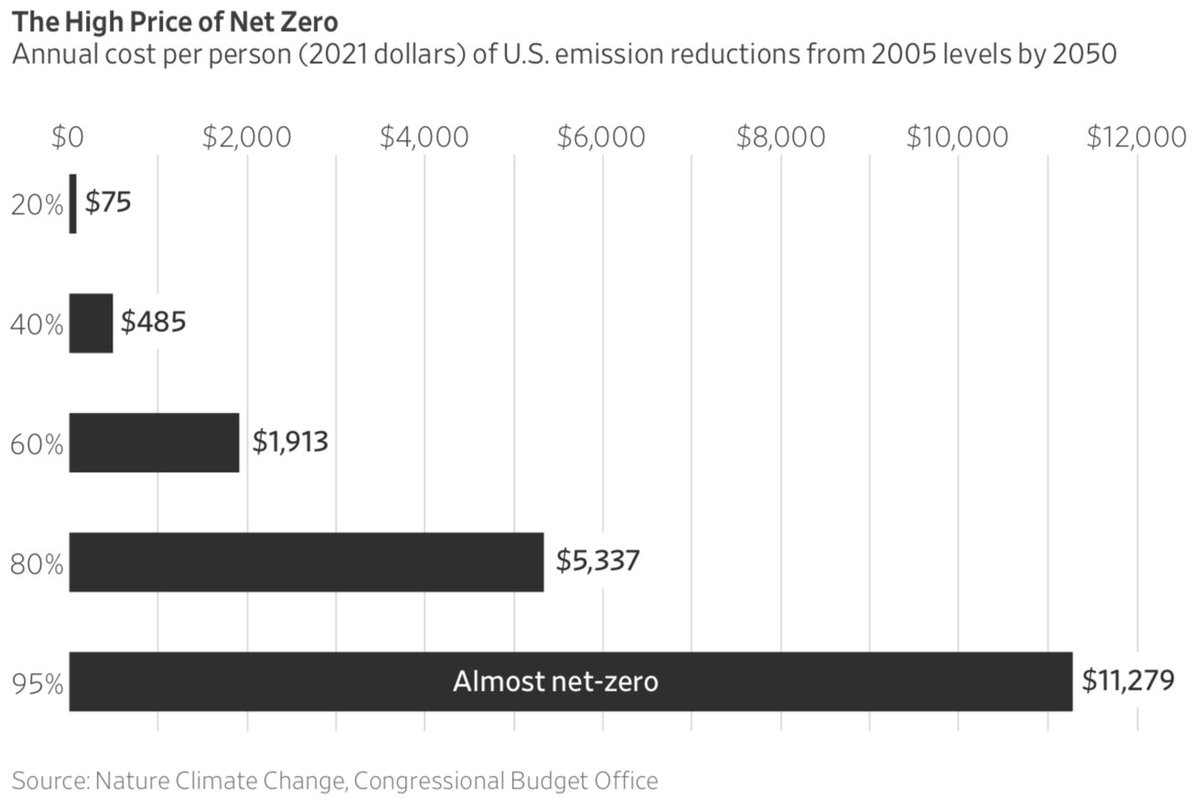
but similar estimates for the US shows 11.9% and for New Zealand 16% of GDP (environment.govt.nz/assets/Publica…)
It would imply costs of €6.300-8.500 per person per year (lower than US, because EU less rich)
but similar estimates for the US shows 11.9% and for New Zealand 16% of GDP (environment.govt.nz/assets/Publica…)
It would imply costs of €6.300-8.500 per person per year (lower than US, because EU less rich)

So we have well-meaning EU leaders jetting off to Glasgow to commit to even stronger climate policies
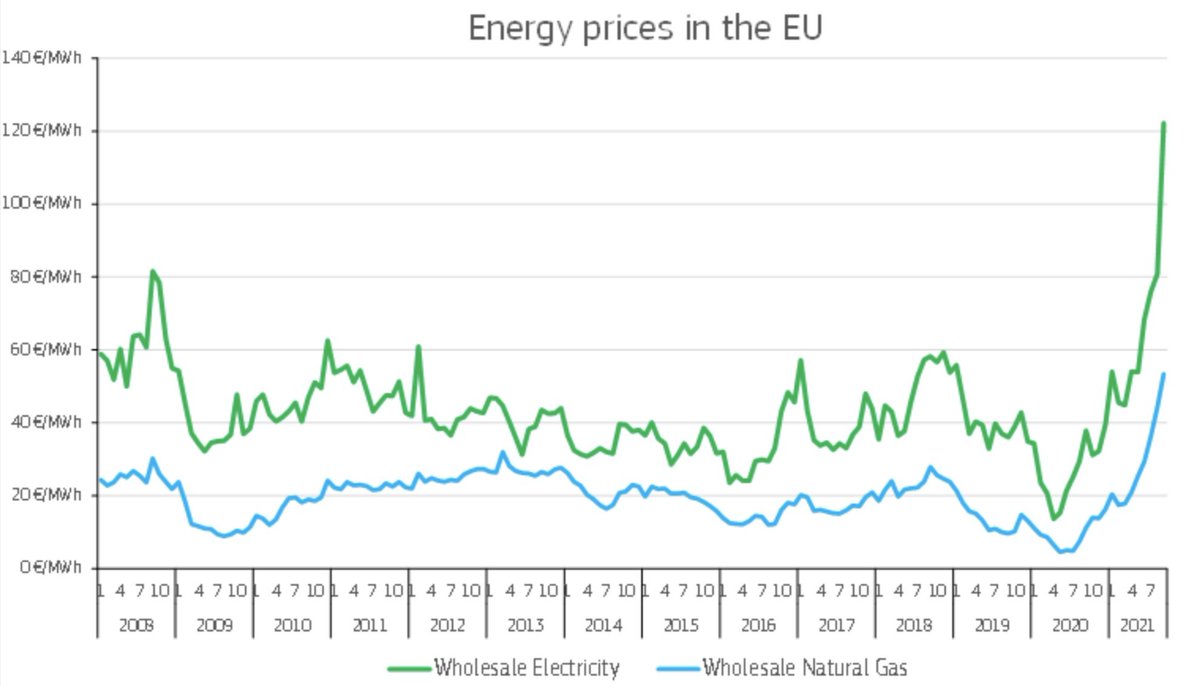
that will drive up energy costs even more
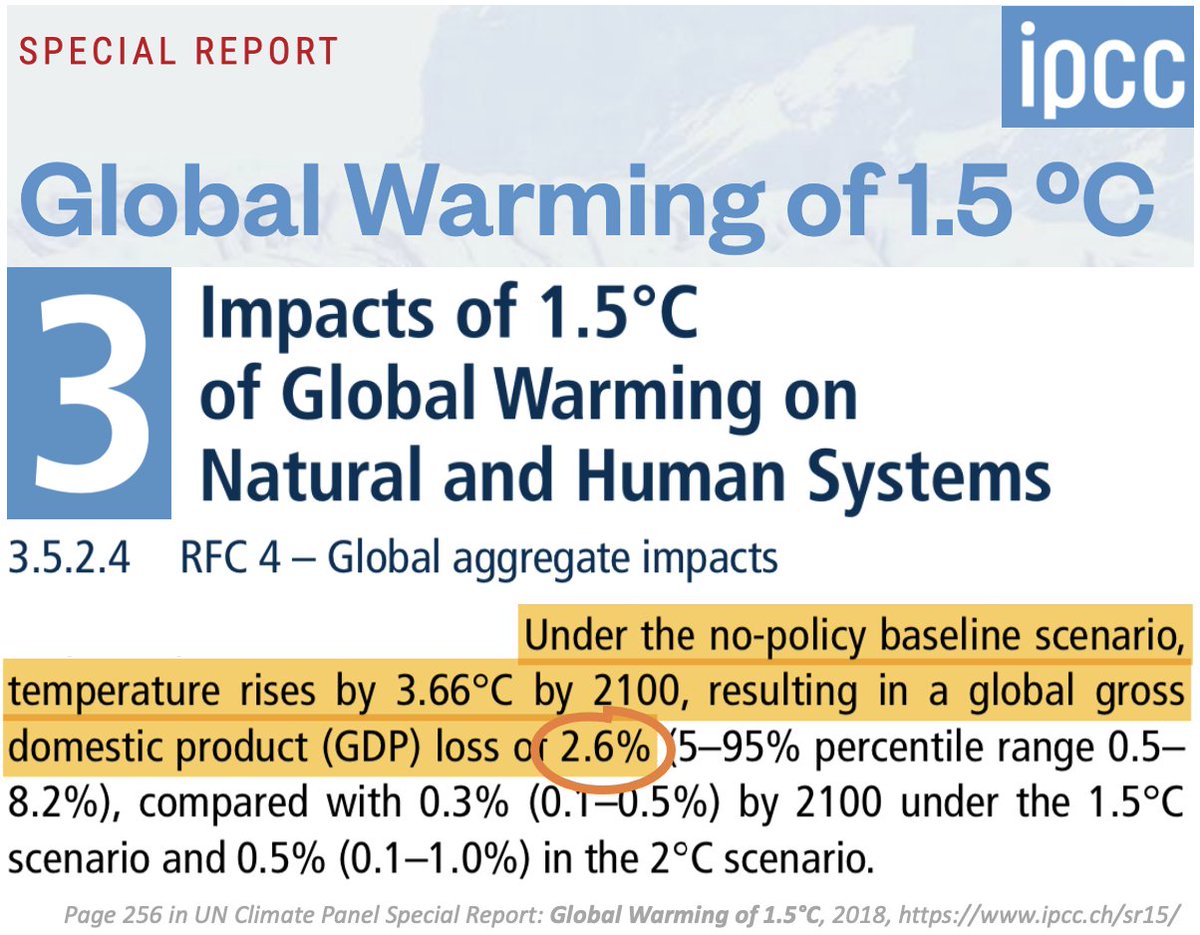
cost EU citizens 10+% of their incomes
while having an immeasurable impact on climate by century's end

that will drive up energy costs even more
cost EU citizens 10+% of their incomes
while having an immeasurable impact on climate by century's end
https://twitter.com/BjornLomborg/status/1450459360837218305

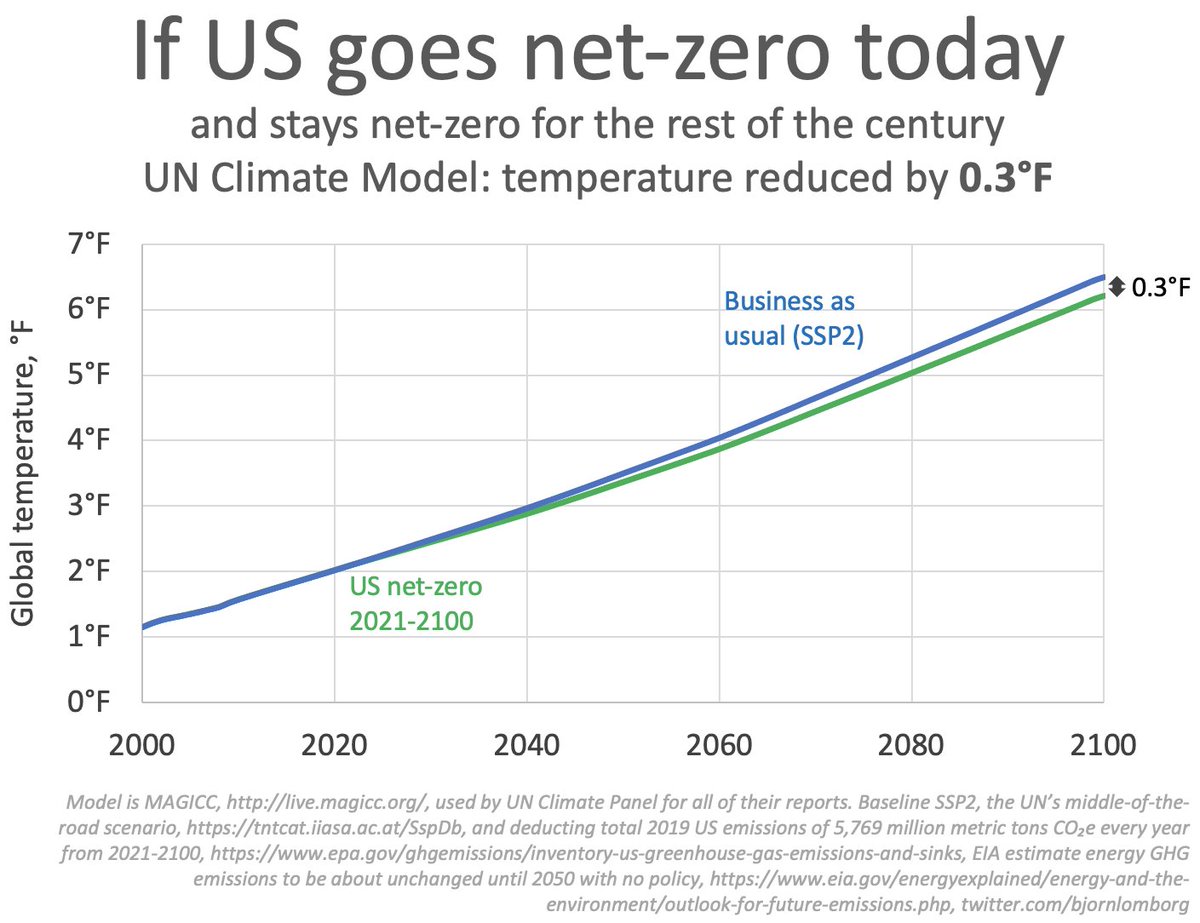
Here is the equivalent impact of the US going net-zero today — 0.3°F (0.16°C)

https://twitter.com/BjornLomborg/status/1449733800649429004

Even if the entire rich world goes net-zero today
impact rather small, reducing temperature rise in 2100 by 0.96°F (0.5°C)
Because vast part of 21st century emissions come from currently poor world
Using UN climate model live.magicc.org
impact rather small, reducing temperature rise in 2100 by 0.96°F (0.5°C)
Because vast part of 21st century emissions come from currently poor world
Using UN climate model live.magicc.org

Here is a thread on the costs of almost net-zero from the new Nature study
https://twitter.com/BjornLomborg/status/1431599612616445958
Notice that the US cost for 80% reduction by 2050 of 5.6% of GDP fits very well with the average cost from the Stanford Energy Modeling Forum estimate of 80% reduction for the EU of 5.14% of GDP (avg of 6 models, ignoring WorldScan extreme cost estimate) worldscientific.com/doi/abs/10.114… 

• • •
Missing some Tweet in this thread? You can try to
force a refresh


