The US beef industry is trying to deflect their responsibility for methane emissions by claiming that emissions US cows are no longer increasing atmospheric methane concentrations. This is technically true, and completely besides the point.

A quick thread: 1/15
The climate impacts of methane is usually compared with CO2 through the use of Global Warming Potentials (GWPs). There are usefully simple multipliers for a single year's emissions, but provide a misleading impression when applied to emissions over time. 2/
CO2 and methane (CH4) have very different lifetimes. When a ton of CO2 is emitted to the atmosphere, a portion is absorbed quickly, but around 40% remains after a century (and 20% after thousands of years). CH4 is removed much faster, with most gone after 20 years. 3/
CO2 is a very stable molecule while CH4 is not. CO2 can only be removed from the atmosphere by being absorbed by vegetation on the land or by the oceans. CH4, on the other hand, oxidizes in the atmosphere after interacting with hydroxyl radical (OH). 4/
What this means, in effect, is that CO2 accumulates in the atmosphere while CH4 does not. CO2 in the atmosphere is a result of all our emissions emissions since the industrial revolution, while the amount of CH4 depends on our rate of our emissions over the past decade or so. 5/
Here is what happens to atmospheric CO2 and CH4 if we emit 1 ton per year for the next 80 years: atmospheric CH4 stabilizes after 20 years or so, while atmospheric CO2 continues to grow: 6/
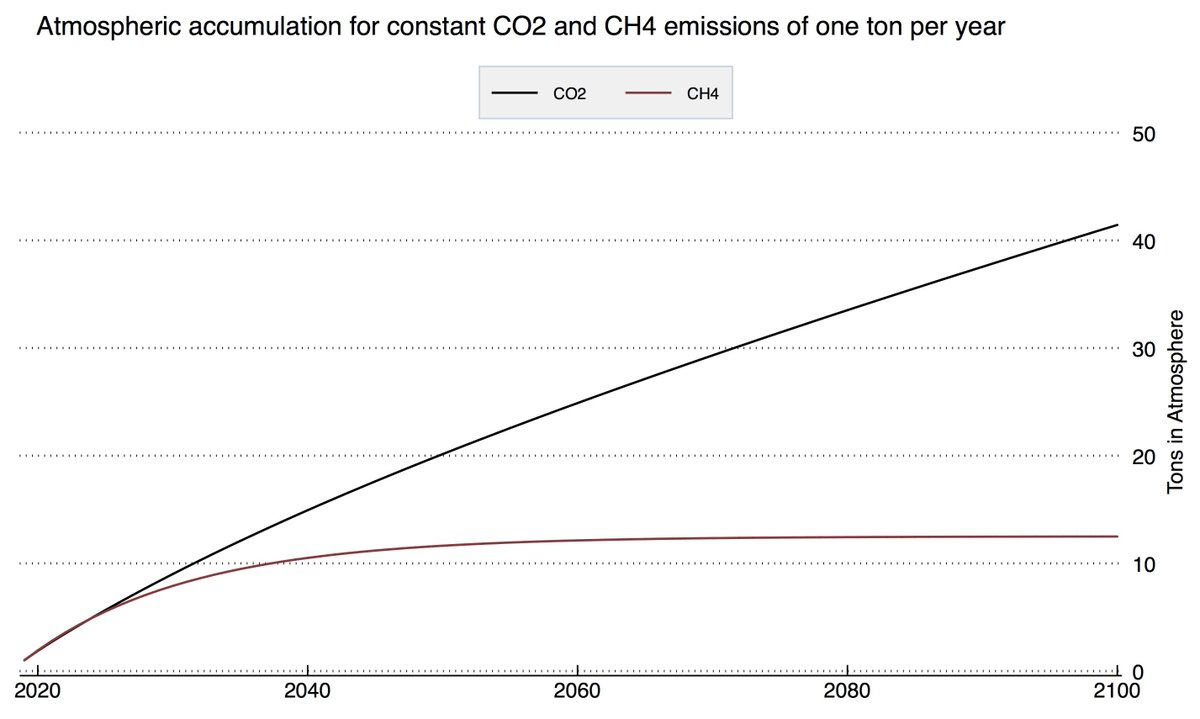
Traditional GWPs do not capture these dynamics at all. They end up overestimating the warming effect of CH4 emissions over time when emissions are increasing when using a 20-year time horizon, and underestimating it when using a 100-year time horizon. 7/
On the flip side, both GWP-20 and GWP-100 overestimate the warming effects of CH4 over time if methane emissions decline.

Thankfully theres a better metric – GWP* – that accurately translates CH4 emissions over time into warming the world experiences: carbonbrief.org/guest-post-a-n… 8/
As the recent IPCC 6th Assessment Report shows, GWP* does a good job of translating CH4 emissions into warming both when emissions are increasing and (in the future) when they are hopefully decreasing (black line is actual warming, green line is GWP*): 9/
However, as the Bloomberg piece points out, some in the beef industry are using GWP* to claim that they are not contributing to climate change anymore, as their herds have not grown (and their CH4 emissions have not increased) over the past decade. 10/
While its technically true that other sectors are contributing to the -increase- in global CH4 emissions today, this misses the fundamental fact that the world needs to dramatically decrease its CH4 emissions to have any hope of meeting its ambitious climate goals. 11/
US cows have contributed a non-trivial chunk of current CH4 in the atmosphere, and are responsible for a portion of historical warming. That herd sizes and beef consumption is not increasing is good, but thats a bar so low its nearly meaningless. 12/
From this standpoint, decreasing US herd sizes (e.g. through people eating less beef and more beef alternatives) or other interventions to reduce US beef CH4 emissions has the exact same effect on the climate as avoiding increasing herd sizes in other countries. 13/
Given that US beef consumption is the 4th highest per capita its more than a little unjust to blame rising CH4 on increased consumption in poorer countries who consume a fraction of the beef a typical American does. 14/
So yes, GWP* is a better metric to use, and in a sense cow herds are like closed powerplants. But we need to dramatically reduce CH4 emissions, not just hold them flat, and US beef producers are still on the hook for their contribution to climate change.

• • •

Missing some Tweet in this thread? You can try to force a refresh
 

Keep Current with Dr. Zeke Hausfather

Dr. Zeke Hausfather Profile picture

Stay in touch and get notified when new unrolls are available from this author!

Read all threads

This Thread may be Removed Anytime!

PDF

Twitter may remove this content at anytime! Save it as PDF for later use!

Try unrolling a thread yourself!

how to unroll video
  1. Follow @ThreadReaderApp to mention us!

  2. From a Twitter thread mention us with a keyword "unroll"
@threadreaderapp unroll

Practice here first or read more on our help page!

More from @hausfath

22 Oct
Interesting discussion in @ISSUESinST about future emissions scenarios. Its encouraging that there is a growing recognition on all side of the debate about the progress we have made in making very high emissions scenarios much less plausible. issues.org/climate-scenar…
I do want to take a bit of an issue with this statement by @chrfield and @Marcia4Science that it "remains 100% accurate" to call RCP8.5 a BAU scenario "even if RCP8.5 does not appear to be the most likely high-emissions pathway."
Both @DetlefvanVuuren and Keywan Riahi who developed the scenario emphasized to me that it was never intended to be "business as usual", but rather a reflection of the upper bound of potential baseline outcomes when RCPs were developed in the late 2000s. carbonbrief.org/explainer-the-… Image
Read 6 tweets
21 Oct
Passing Build Back Better bill without CEPP risks premature retirement of 20% of current US nuclear reactors, jeopardizing emissions reductions goals. To avoid this the US should extend PTC for existing nuclear from 5 years to 10 years to fill in the gap: thebreakthrough.org/issues/energy/…
CEPP is likely gone from the budget reconciliation bill. It was a major incentive to keep existing reactors open, and as @JesseJenkins and the REPEAT team find its absence will result in an additional 20 GW (20% of existing nuclear) retiring by 2030. repeatproject.org/docs/REPEAT_Pr…
This means that the additional clean energy is replacing nuclear rather than fossil fuels, resulting in additional CO2 emissions of up to 75 million metric tons per year in 2030 compared to a scenario where these reactors remained open.
Read 9 tweets
19 Oct
Winter La Niña is coming. iri.columbia.edu/our-expertise/…
Its decidedly an outlier, but that NASA GMAO model... 🤯
Interesting to compare October 2020 and October 2021 projections, remarkably similar:
Read 4 tweets
19 Oct
2021 saw the warmest summer for the Earth's land regions, and is on track to be between the 5th and 7th warmest year since records began in the mid-1800s. For an update on temps, models, GHGs, and sea ice see our @CarbonBrief Q3 State of the Climate: carbonbrief.org/state-of-the-c…
Summer land temperatures were relatively flat until 1975, with only around 0.2C warming up to that point. Today, summer land temperatures are around 1.5C above pre-industrial levels, with around 1.3C of that warming happening in just the past 45 years.
NW North America, Eastern Europe, Middle East, Northern Africa, and Siberia all had an exceptionally warm summer. China, sub-Saharan Africa, South America and Australia were modestly above average, while parts of Central America and India were below average.
Read 17 tweets
15 Oct
There is a weird narrative in some quarters that wind and solar are pure good, while electric vehicles are a necessary (or even unnecessary) evil. This is wrong for many reasons. Yes, we should invest more in public transit and cycle more. We should also be more energy efficient.
But all replacements to fossil fuels will have impacts. Covering 14% of all the US land area with wind and solar farms is potentially doable – but it still has a big impact. EVs are heavier and thus potentially more deadly than ICEs, and batteries are GHG intensive to make.
This does not mean they are not worth doing. We can build much more renewables (and clean firm generation), invest in public transit, replace ICEs and EVs, etc. But if we pretend it will be small and beautiful rather than big and messy we are setting ourselves up for failure.
Read 4 tweets
15 Oct
One of the biggest long-term impacts of climate change is sea level rise. Even in more moderate emissions scenarios we likely commit the world to many meters of future sea level rise over the next millennium – barring massive anthropogenic carbon removal in future centuries.
The folks at @ClimateCentral have an evocative new visualization of what sea level rise over the next ~1000 years would look like if it happened to cities today. They focus on a 3C warming case – consistent with best estimates of current policy outcomes: picturing.climatecentral.org
Of course, 1000 years is a long time. Who knows what our cities (or species) will look like that far in the future, what actions we might be able to take to slow down or reverse ice sheet loss, or what infrastructure we may build to hold back the rising seas.
Read 4 tweets

Did Thread Reader help you today?

Support us! We are indie developers!


This site is made by just two indie developers on a laptop doing marketing, support and development! Read more about the story.

Become a Premium Member ($3/month or $30/year) and get exclusive features!

Become Premium

Too expensive? Make a small donation by buying us coffee ($5) or help with server cost ($10)

Donate via Paypal Become our Patreon

Thank you for your support!

Follow Us on Twitter!

:(