Most are correcting yesterday's low to today's opening high.
Keep the retrace handy
38%-50% retrace is bullish
61.8% is average strength
Anything beyond it, reject it and reconsider only if the high is surpassed
For Eg: Nifty holding "17855-892" is bullish
Break of 17817, reject
Keep the retrace handy
38%-50% retrace is bullish
61.8% is average strength
Anything beyond it, reject it and reconsider only if the high is surpassed
For Eg: Nifty holding "17855-892" is bullish
Break of 17817, reject

#Reliance has done exactly 61.8% retrace of 2494 to 2556 @ 2518
Today's low 2518.
Below this, wouldn't consider it.
IF breaks 2518, consider it only above 2545 or 2556
Today's low 2518.
Below this, wouldn't consider it.
IF breaks 2518, consider it only above 2545 or 2556

#sbin
Rose from 501 to 522
It's retrace is @ 511.50 -514, a bullish possibility.
Made a low of 513.60 so far.
Below 509, reject it.
And, consider it only if moves above 522.
Rose from 501 to 522
It's retrace is @ 511.50 -514, a bullish possibility.
Made a low of 513.60 so far.
Below 509, reject it.
And, consider it only if moves above 522.

#Icicibank
Moved up from 793 to 810 (Last rise)
It's 38% - 50% retrace @ 801.50-803.50, made a low today @ 802.35 = Bullish.
Reject it if breaks 799 & then, consider it only IF moves above 810.
Moved up from 793 to 810 (Last rise)
It's 38% - 50% retrace @ 801.50-803.50, made a low today @ 802.35 = Bullish.
Reject it if breaks 799 & then, consider it only IF moves above 810.

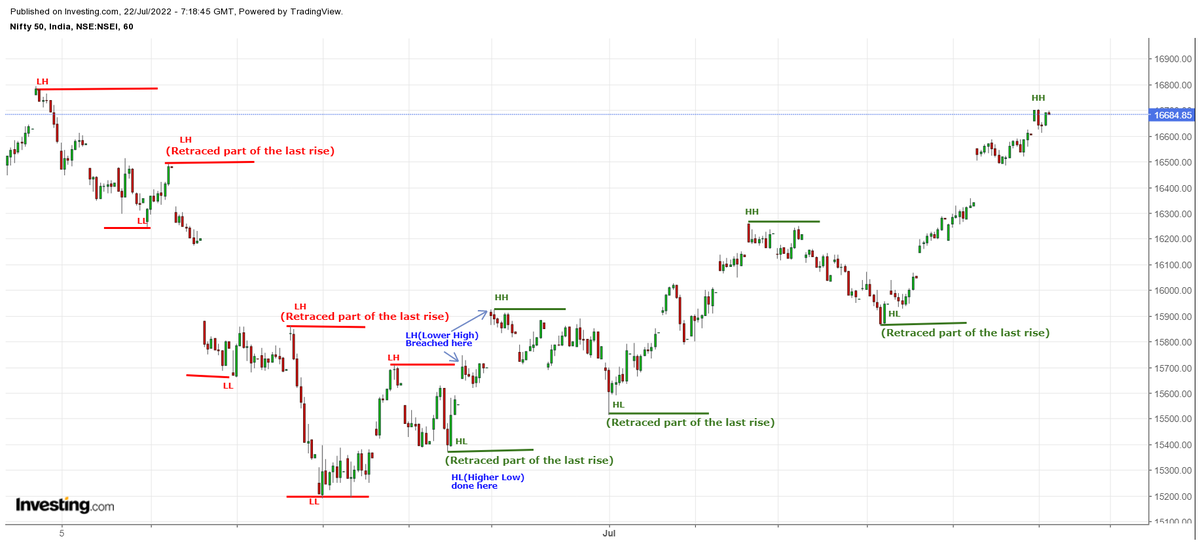
What is all this logic ?
#Elliottwave IF taught me 1 major deciding factor is
"Managing positions with Last Rise retrace"
Most did a 5 from yesterday's low to today's opening high.
5 is retraced by a 3 (abc)
Look to enter @ retrace to get a LRHR trade
#Elliottwave IF taught me 1 major deciding factor is
"Managing positions with Last Rise retrace"
Most did a 5 from yesterday's low to today's opening high.
5 is retraced by a 3 (abc)
Look to enter @ retrace to get a LRHR trade
Nature of retrace or the correction reveals a lot about the strength/ weakness of the stock/ index
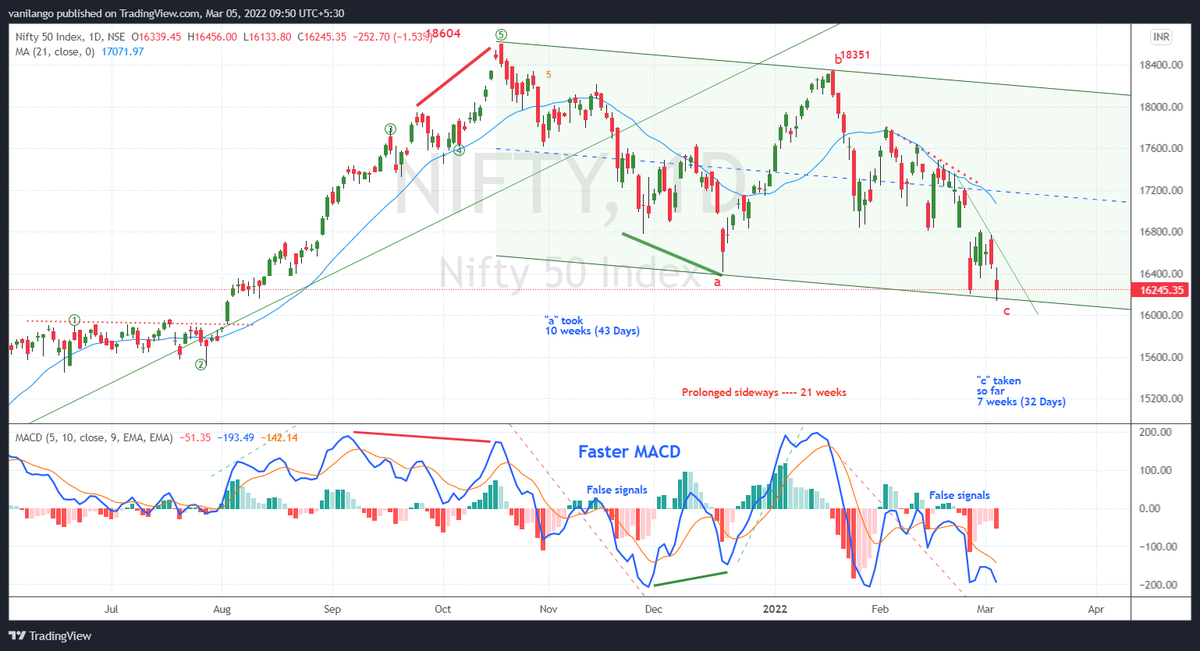
There could be minor whipsaw @ golden ratio, 61.8%
Nothing is perfect. Manage this whipsaw with 80% retrace no
Try & practice it & see for yourself the efficiency of this system
There could be minor whipsaw @ golden ratio, 61.8%
Nothing is perfect. Manage this whipsaw with 80% retrace no
Try & practice it & see for yourself the efficiency of this system
#Nifty retraced to 17872 so far & now @ 17910++
#Reliance fell more than 61.8% but not below 80% so far @ 2508
#SBI retraced to 512.05 & mow moving up
#Icicibank retraced to 61.8% @ 799 & up now.
#Reliance fell more than 61.8% but not below 80% so far @ 2508
#SBI retraced to 512.05 & mow moving up
#Icicibank retraced to 61.8% @ 799 & up now.

• • •
Missing some Tweet in this thread? You can try to
force a refresh